

From TradersList Editors
From TradersList Editors
Leverage this versatile indicator to visualize market volume and liquidation ranges, enhancing crypto trading decisions effectively.
Leverage this versatile indicator to visualize market volume and liquidation ranges, enhancing crypto trading decisions effectively.


TradingView Indicator
TradingView Indicator
Liquidations & Volume Bubbles with this Free TradingView Indicator
Liquidations & Volume Bubbles with this Free TradingView Indicator

by KioseffTrading on TradingView
by KioseffTrading on TradingView
by KioseffTrading on TradingView
🤖
Liquidation Ranges + Volume/OI Dots [Kioseff Trading]
Liquidation Ranges + Volume/OI Dots [Kioseff Trading]
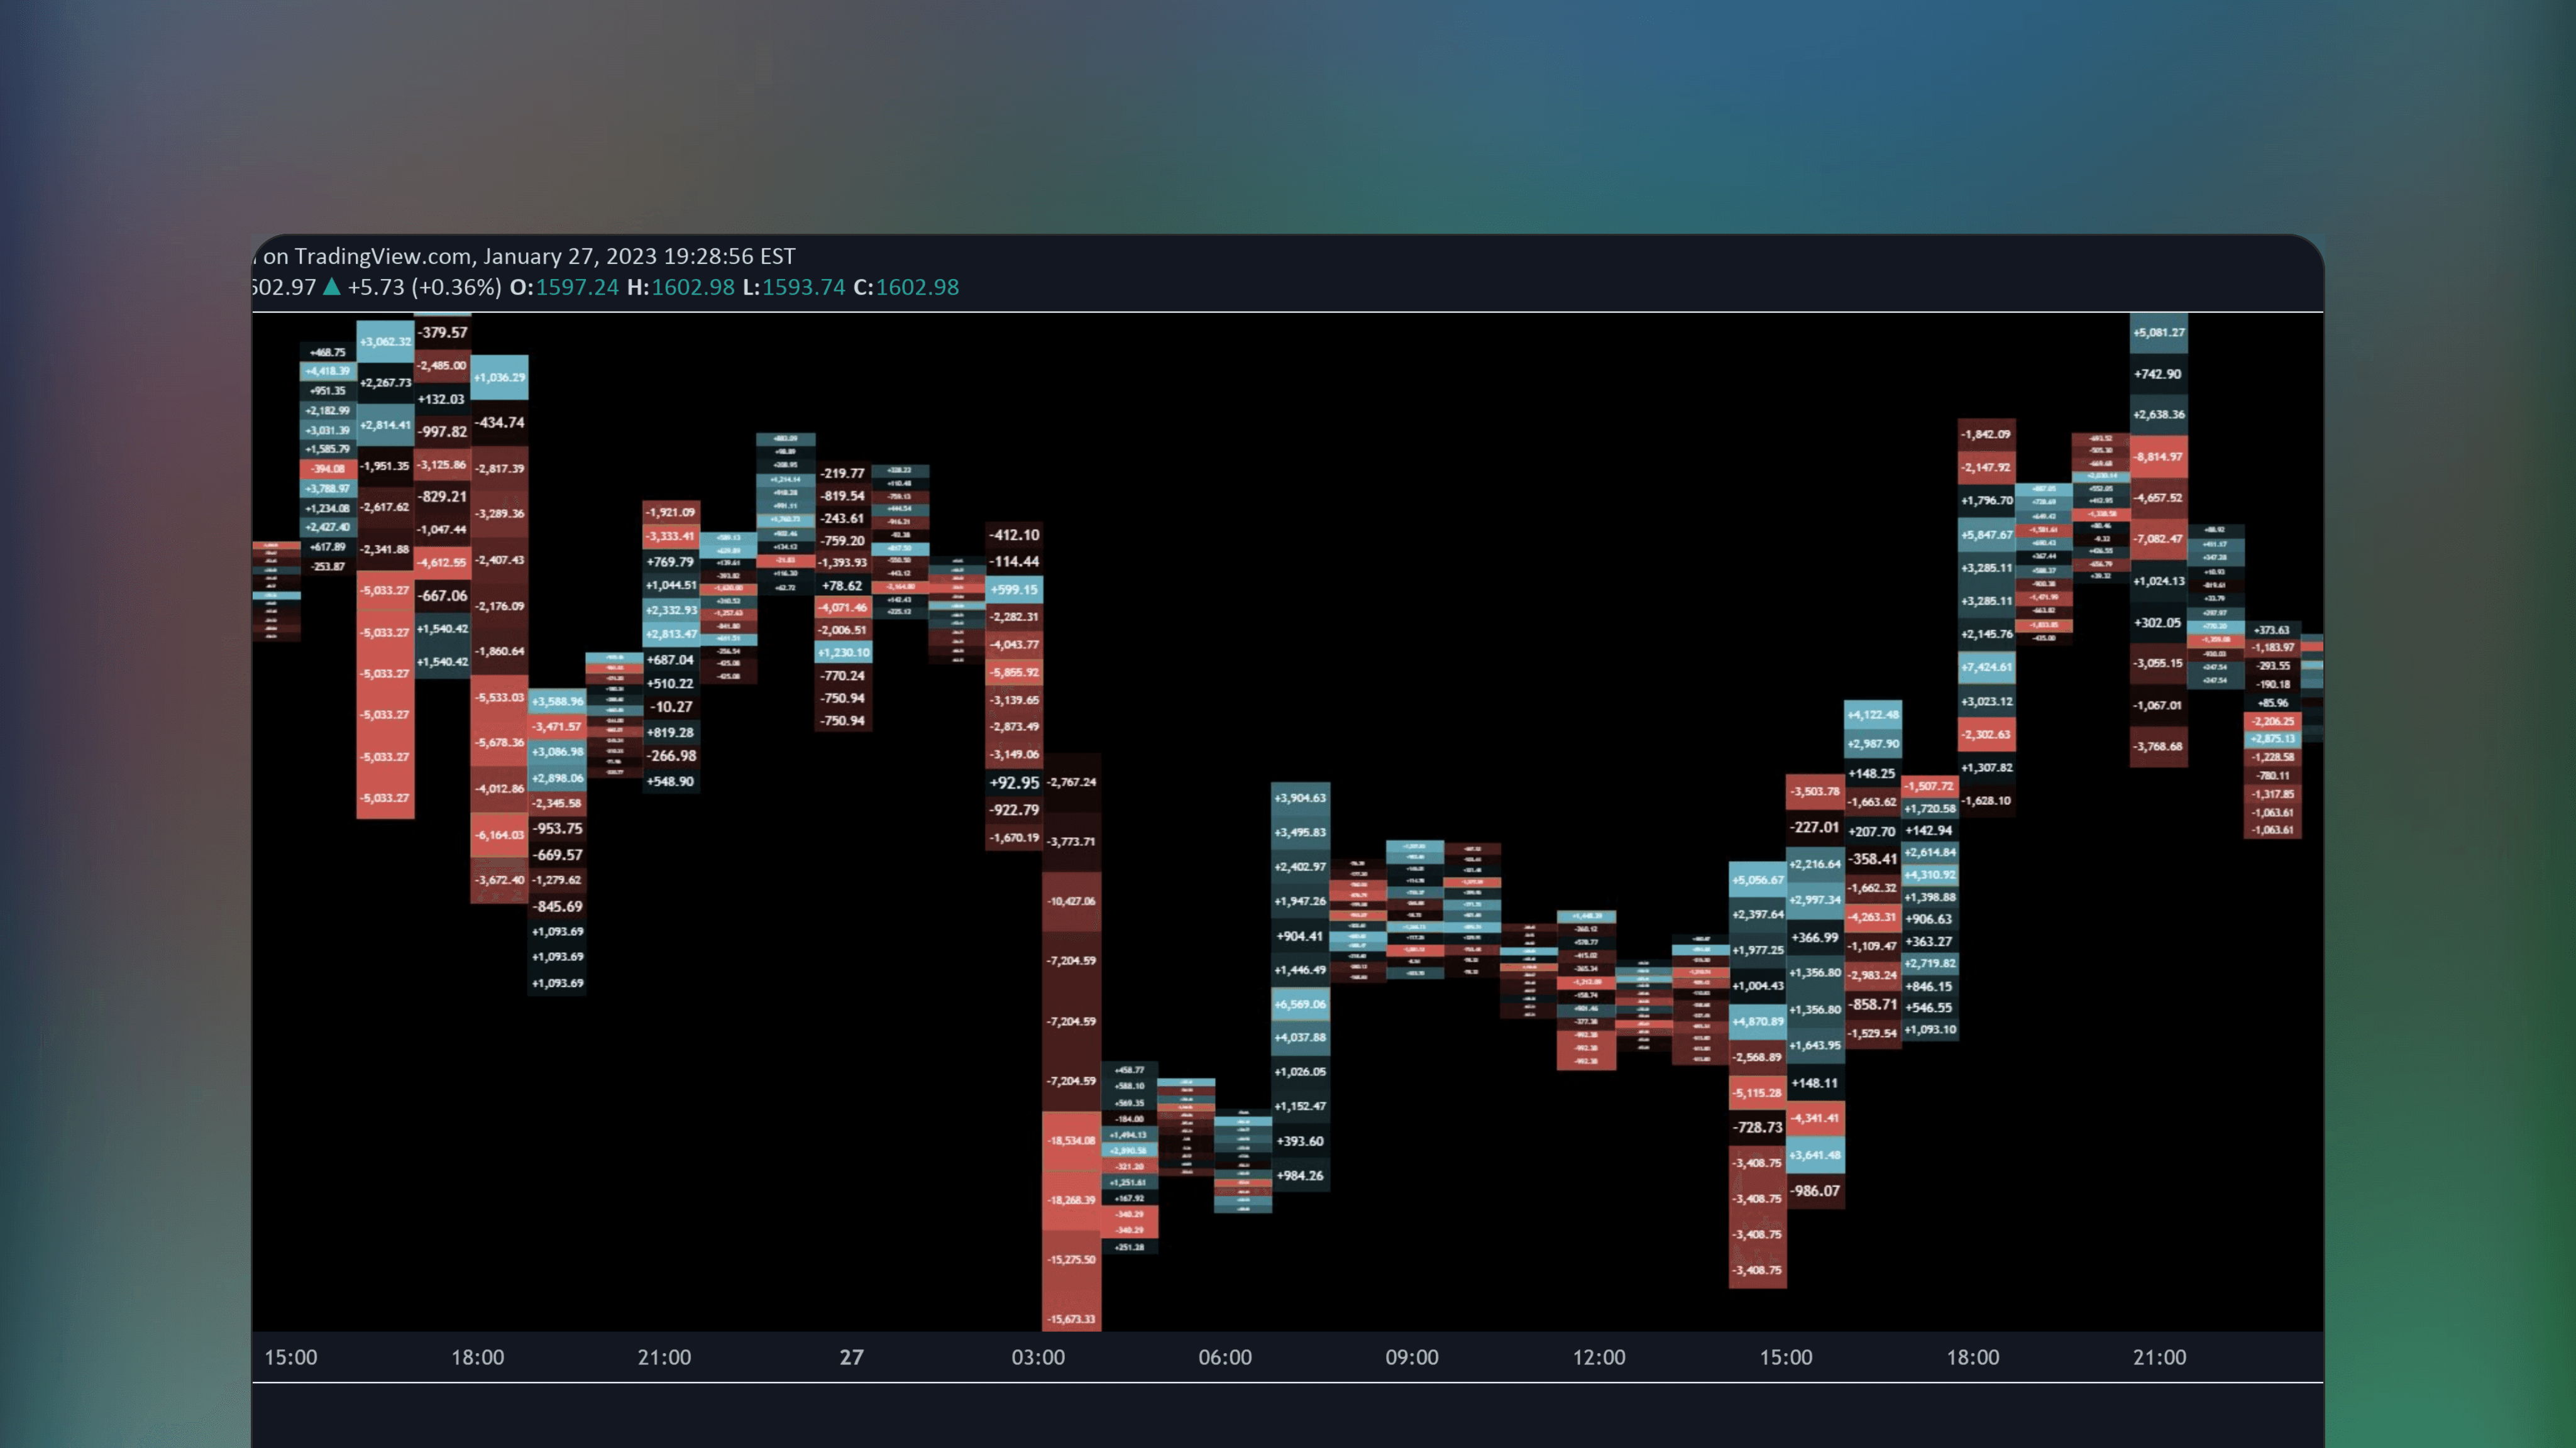
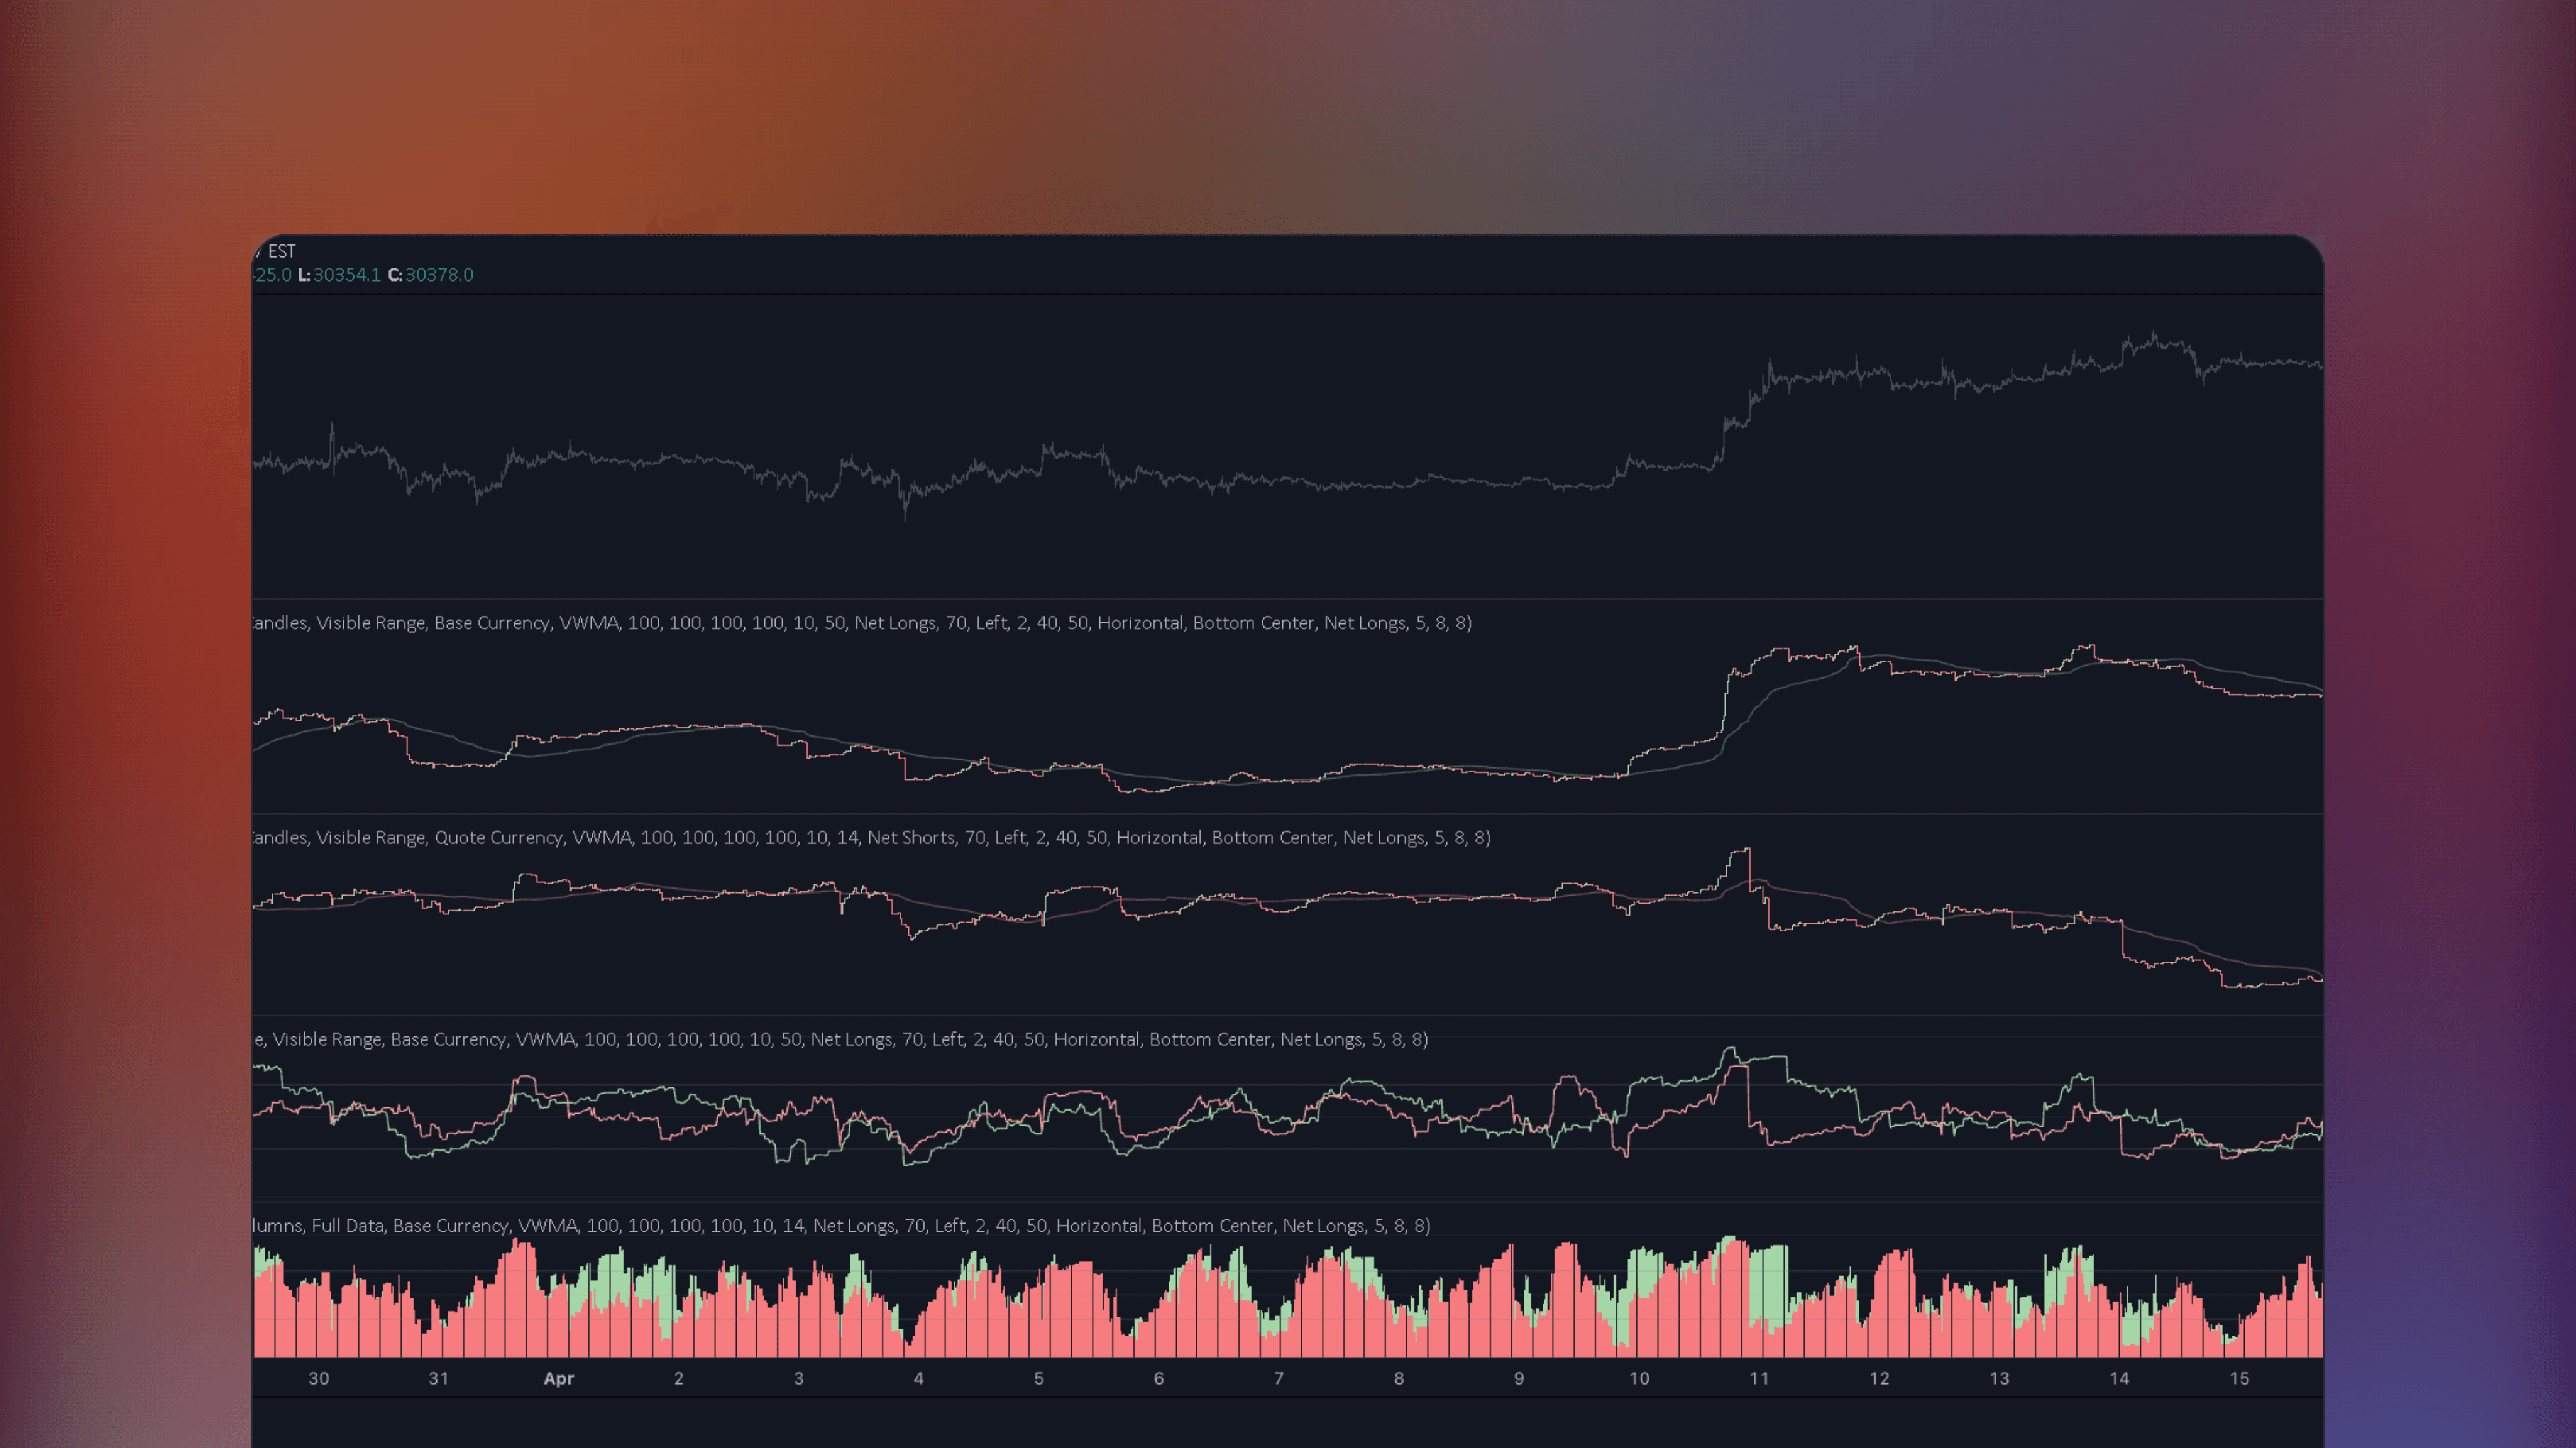
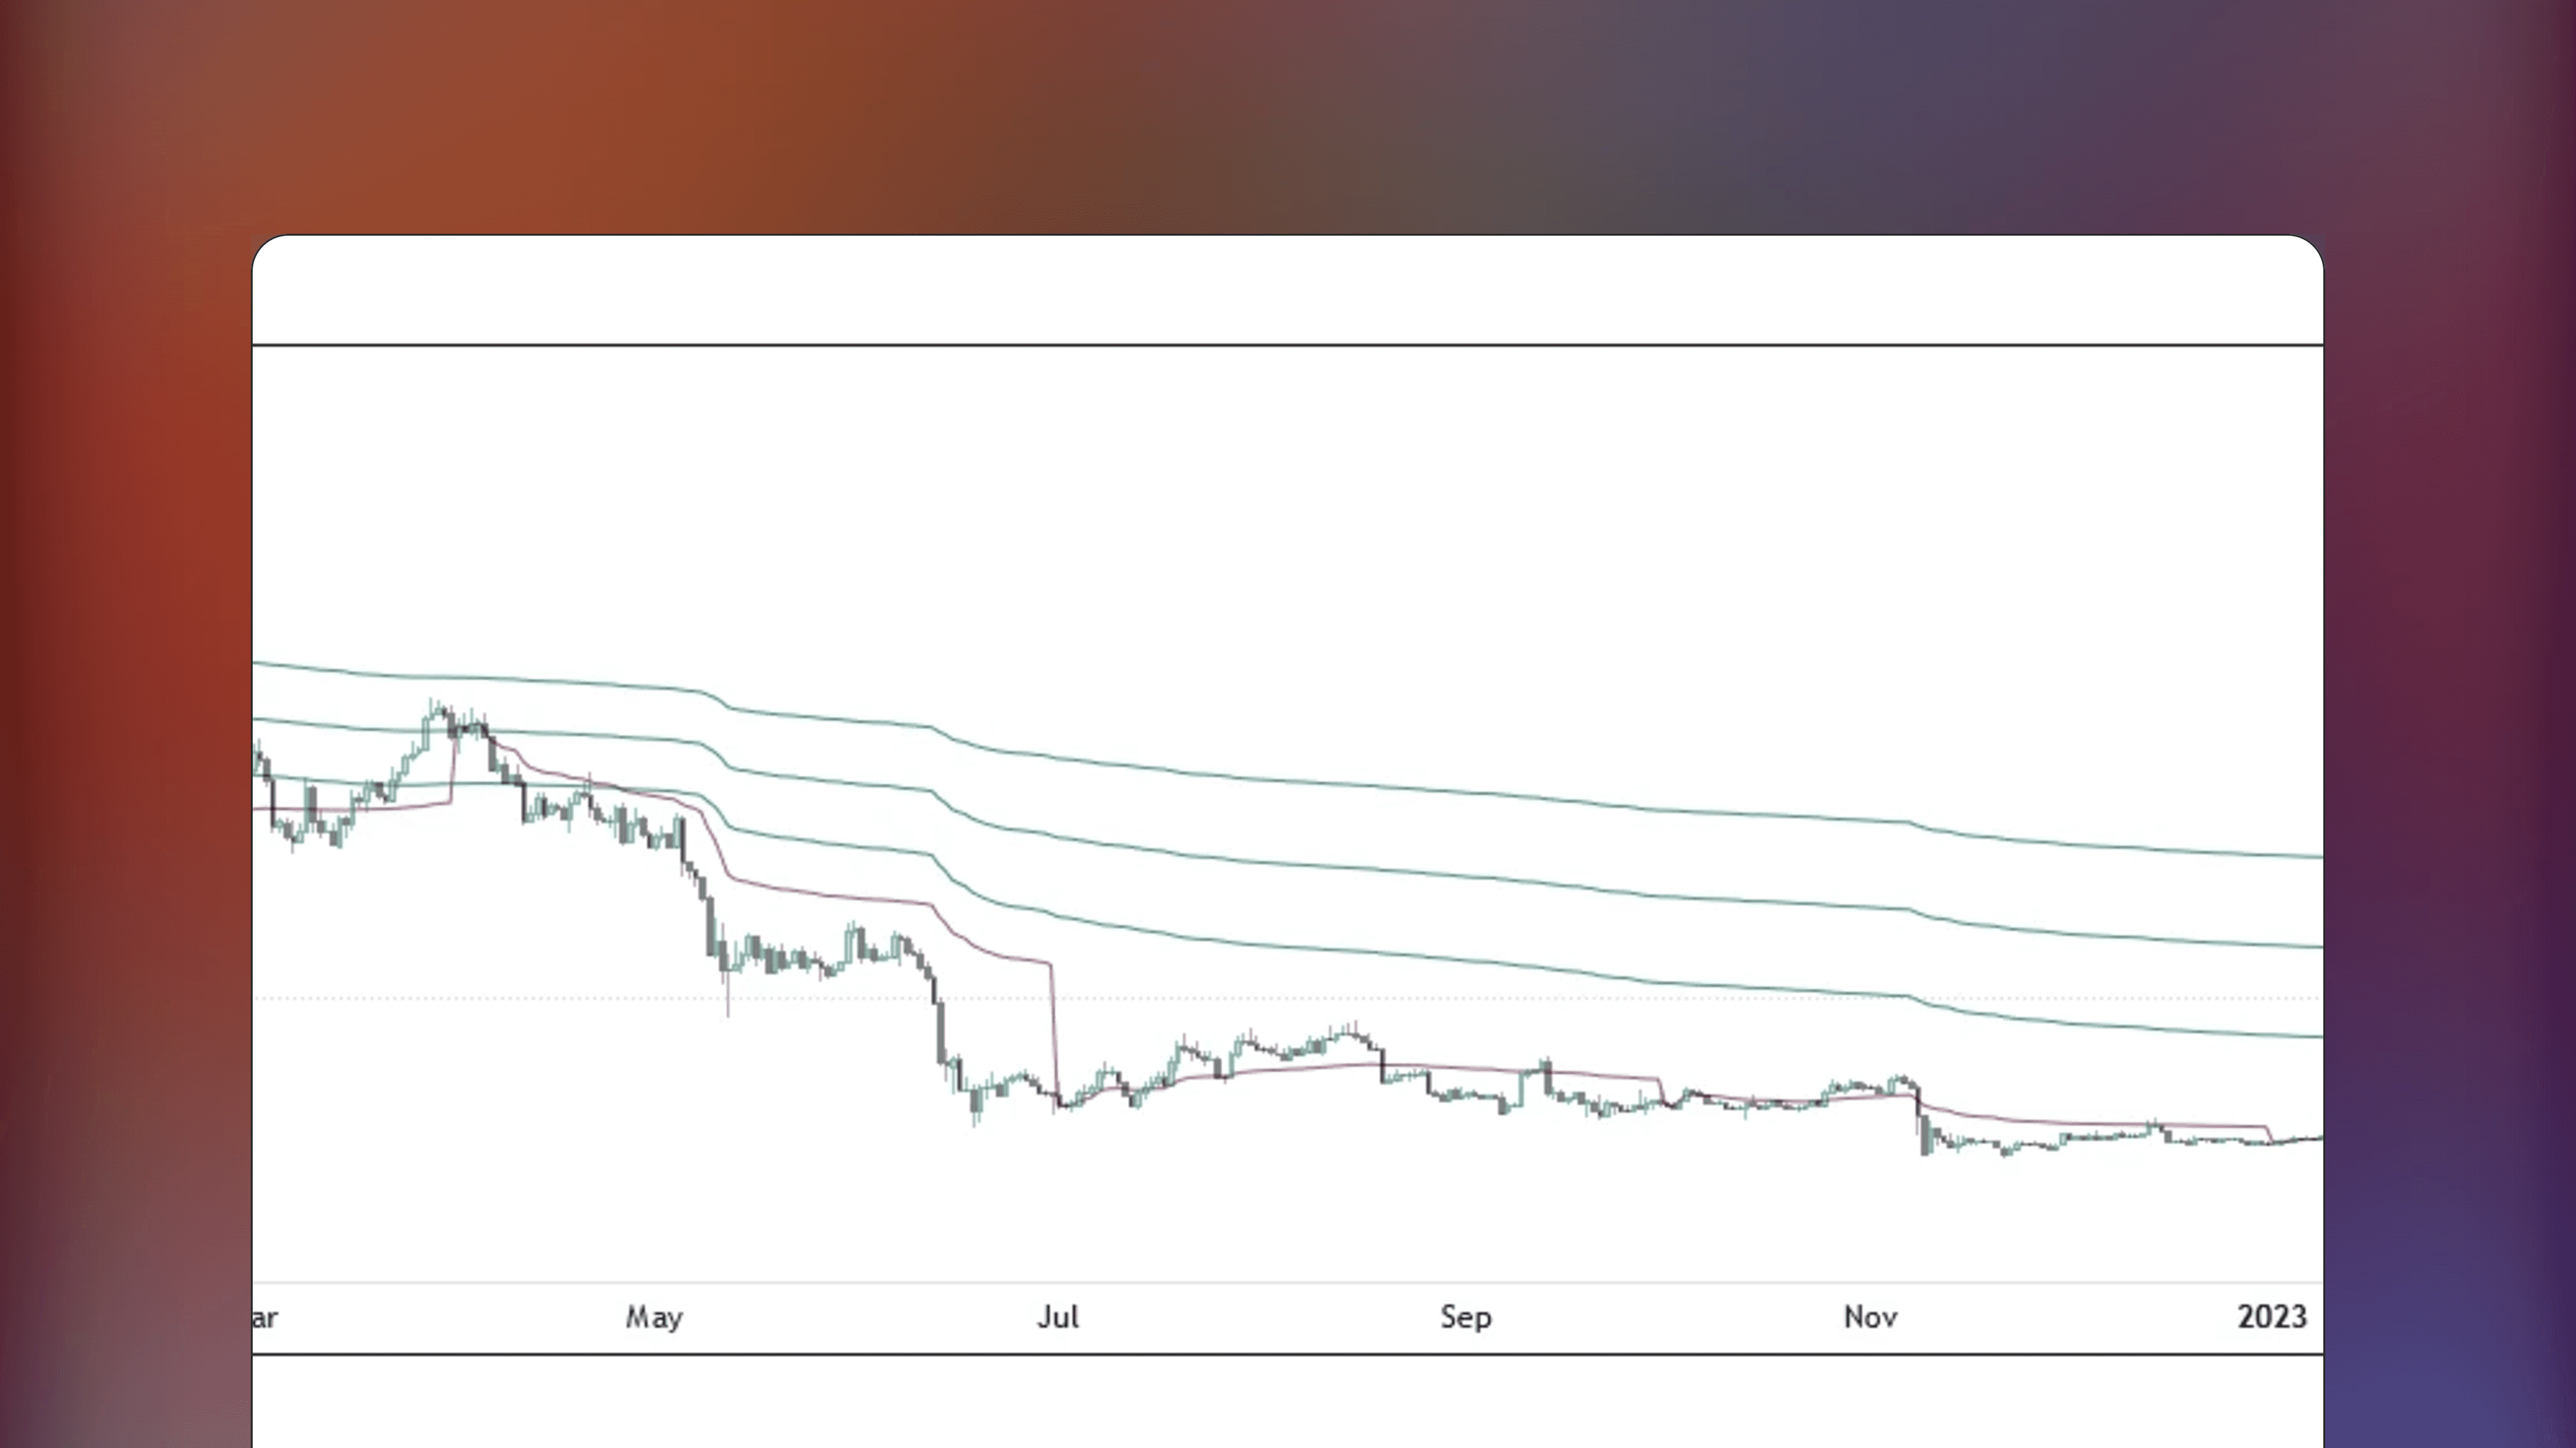
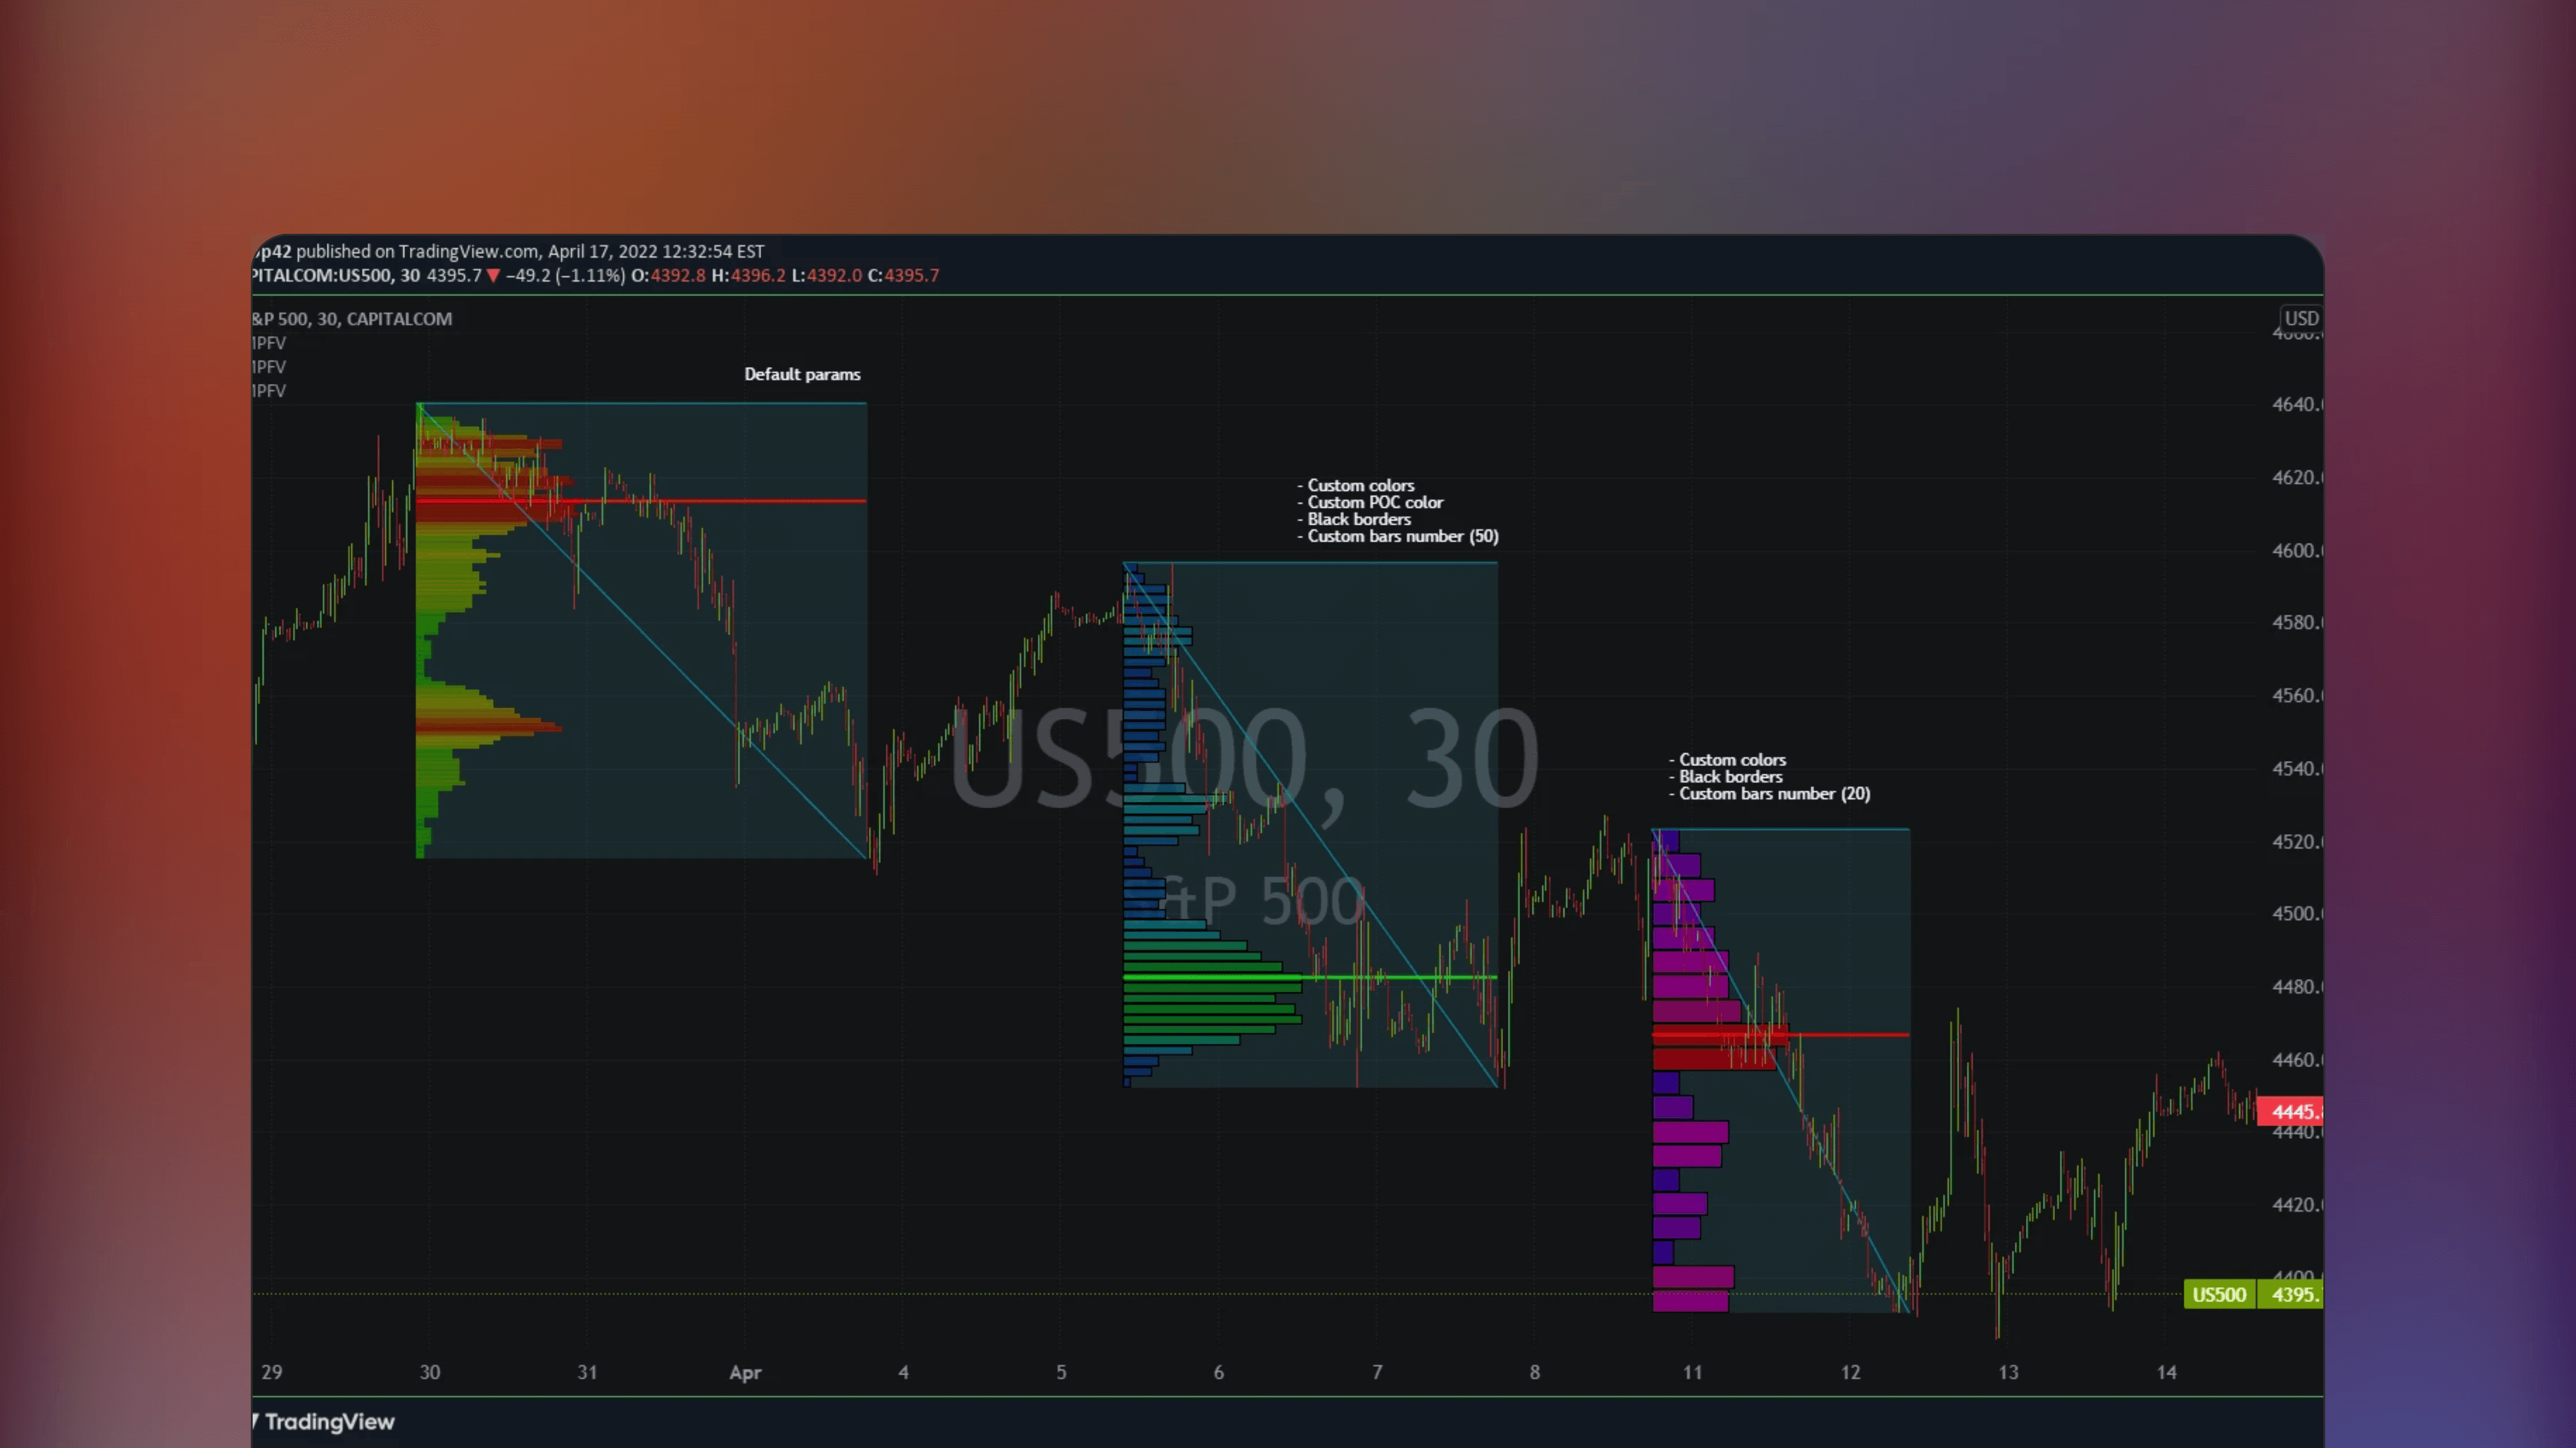
Liquidation Ranges + Volume/OI Dots by Kioseff Trading is a TradingView indicator that combines multiple volumetric tools in one. View high volume events (volume dots), liquidation ranges on crypto assets and key points of interest to highlight support and resistance areas.
Liquidation Ranges + Volume/OI Dots by Kioseff Trading is a TradingView indicator that combines multiple volumetric tools in one. View high volume events (volume dots), liquidation ranges on crypto assets and key points of interest to highlight support and resistance areas.
Get on TradingView
This indicator is available on TradingView web charting platform. Signing up for a free account is required, no downloads.
Get on TradingView
This indicator is available on TradingView web charting platform. Signing up for a free account is required, no downloads.
🔑
Open Source
Listing has publically available source code that can be audited and modified as needed.
🔑
Open Source
Listing has publically available source code that can be audited and modified as needed.
💸
Free Access
All features of this listing are fully free to use with no pricing tiers. Simply start using.
💸
Free Access
All features of this listing are fully free to use with no pricing tiers. Simply start using.
🥇
Trusted Publisher
Publisher of this listing is well recognized in social channels and receives overwhelmingly positive feedback.
🥇
Trusted Publisher
Publisher of this listing is well recognized in social channels and receives overwhelmingly positive feedback.
✅
Robust Theory
Concepts and theories mentioned in listing are based on generally approved and well established notions.
✅
Robust Theory
Concepts and theories mentioned in listing are based on generally approved and well established notions.
🌐
Popular Topic
Concepts and theories mentioned in listing are popular topics in web search
🌐
Popular Topic
Concepts and theories mentioned in listing are popular topics in web search
Published by KioseffTrading on TradingView
Published by KioseffTrading on TradingView
Featured Dec 6, 2024
Featured Dec 6, 2024
A multi-purpose tool for liquidations and volume anomalies
A multi-purpose tool for liquidations and volume anomalies
This TradingView indicator identifies crypto liquidation ranges and volume points to highlight potential key areas for support and resistance. Let's take a look at how you might apply Liquidation Ranges + Volume/OI Dots [Kioseff Trading] in your market evaluations.
This TradingView indicator identifies crypto liquidation ranges and volume points to highlight potential key areas for support and resistance. Let's take a look at how you might apply Liquidation Ranges + Volume/OI Dots [Kioseff Trading] in your market evaluations.
1
1
Detect volume anomalies
Detect volume anomalies
2
2
Streamline volume analysis
Streamline volume analysis
3
3
Track fair value deviations
Track fair value deviations
😃
😃
Traders are happy with this
Traders are happy with this
Users appreciate Liquidation Ranges + Volume/OI Dots by Kioseff for its insights into liquidation points using volume and OI data, but the lack of direct feedback makes user sentiment speculative.
Users appreciate Liquidation Ranges + Volume/OI Dots by Kioseff for its insights into liquidation points using volume and OI data, but the lack of direct feedback makes user sentiment speculative.
Source: Online Discussion
Source: Online Discussion
Source: Online Discussion


Bookmark
Saved here
🤖
Get Indicator
Find Indicator
3
Comments
Read on Telegram
Listing by third party publisher. Not financial advice.
Risk Disclosure


Share Listing
🤖
🤖
Get Indicator
Get Indicator
Find Indicator
Find Indicator
Saved here
Bookmark
Listing by third party publisher. Not financial advice.
Listing by third party publisher. Not financial advice.
Risk Disclosure
Risk Disclosure
Share
🤖
3


🤖
3
🤖
3
✍️
By Author
More by KioseffTrading
🤖
by KioseffTrading

Free
TradingView Indicator
Delta Ladder [Kioseff Trading]
🔑
🌐
✅
Delta Ladder [Kioseff Trading] is a free TradingView Indicator that visualizes buy and sell volume at price. This indicator presents volume delta data in various formats, such as Classic mode with volume delta based colored boxes and numeral volume information.

🤖
by KioseffTrading
Free
TradingView Indicator
Zig-Zag Volume Profile (Bull vs. Bear) [Kioseff Trading]
🔑
🌐
Zig-Zag Volume Profile (Bull vs. Bear) [Kioseff Trading] is a TradingView indicator that displays bullish and bearish volume distributions using unique Zig-Zag style visualization.

🤖
by KioseffTrading

Free
TradingView Indicator
Sync Frame (MTF Charts) [Kioseff Trading]
🔑
🌐
🏅
Sync Frame (MTF Charts) [Kioseff Trading] is a free TradingView indicator that allows users to view multiple lower timeframe charts for any asset simultaneously, in various formats, on a single screen.
Load More
🤖
by KioseffTrading
Free
TradingView Indicator
Delta Ladder [Kioseff Trading]
🔑
🌐
✅
Delta Ladder [Kioseff Trading] is a free TradingView Indicator that visualizes buy and sell volume at price. This indicator presents volume delta data in various formats, such as Classic mode with volume delta based colored boxes and numeral volume information.
🤖
by KioseffTrading
Free
TradingView Indicator
Zig-Zag Volume Profile (Bull vs. Bear) [Kioseff Trading]
🔑
🌐
Zig-Zag Volume Profile (Bull vs. Bear) [Kioseff Trading] is a TradingView indicator that displays bullish and bearish volume distributions using unique Zig-Zag style visualization.
Load More
🔥
New Listings
Featured this week

🤖
by benten


Free
ThinkOrSwim Indicator
Triple VWAP Indicator For ThinkOrSwim
New
🔑
✅
Triple VWAP Indicator for ThinkorSwim VWAP by adding 1 to 3 standard deviation bands alongside VWAP, providing a more detailed view of extreme deviations based on market volatility.
🤖
by scriptor

Free
MetaTrader Indicator
Volume_Accumulation
New
🔑
🌐
Volume_Accumulation is a MetaTrader Indicator that displays volume accumulation and distribution using a specialized formula. The indicator requires no inputs or settings, simply start using.
🤖
by twingall
Free
TradingView Indicator
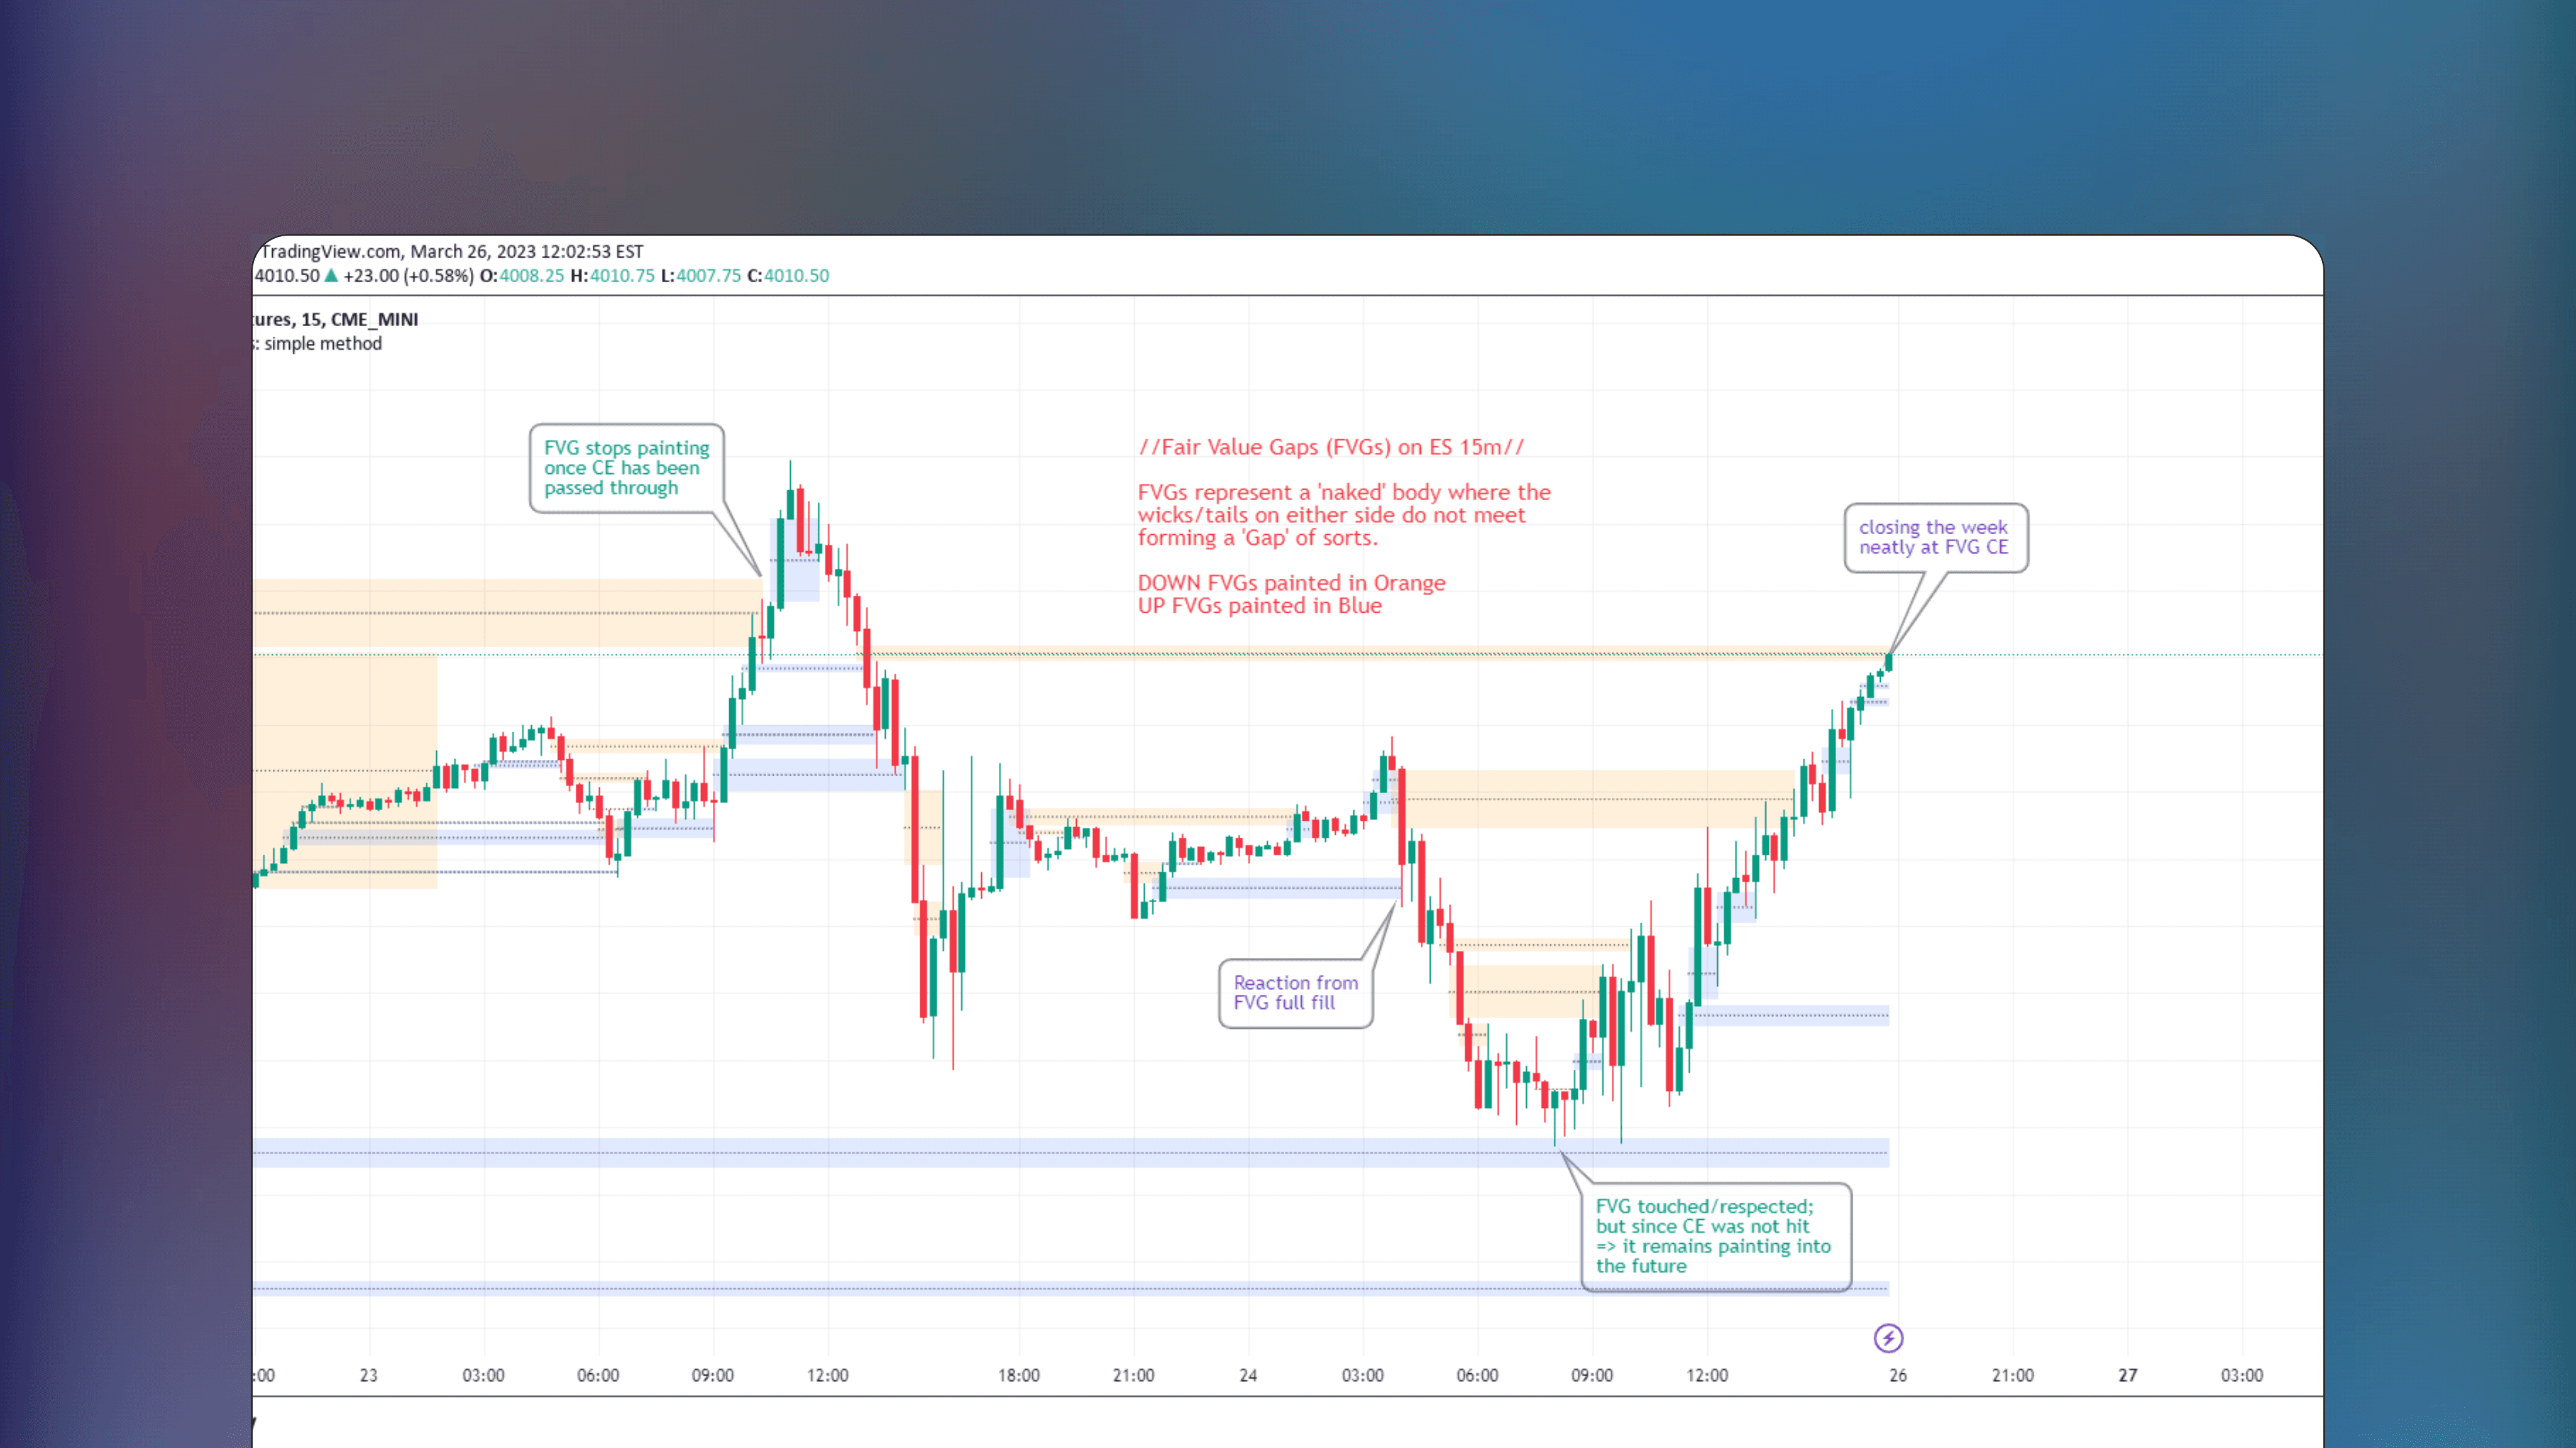
FVGs & CEs + Alerts: simple & efficient method
New
🔑
✅
FVGs & CEs + Alerts is a TradingView indicator that identifies and marks Fair Value Gaps and their midlines. Fair Value Gaps are not displayed when conditions like hitting a CE or fully filling the gap are met, decreasing clutter. Includes alerts for fills.
🤖
by benten
Free
ThinkOrSwim Indicator
Triple VWAP Indicator For ThinkOrSwim
New
🔑
✅
Triple VWAP Indicator for ThinkorSwim VWAP by adding 1 to 3 standard deviation bands alongside VWAP, providing a more detailed view of extreme deviations based on market volatility.
🤖
by scriptor
Free
MetaTrader Indicator
Volume_Accumulation
New
🔑
🌐
Volume_Accumulation is a MetaTrader Indicator that displays volume accumulation and distribution using a specialized formula. The indicator requires no inputs or settings, simply start using.
Load More
🤖
Similar Listings
Traders also viewed
All

🤖
by KioseffTrading
Free
TradingView Indicator
Delta Ladder [Kioseff Trading]
🔑
🌐
✅
Delta Ladder [Kioseff Trading] is a free TradingView Indicator that visualizes buy and sell volume at price. This indicator presents volume delta data in various formats, such as Classic mode with volume delta based colored boxes and numeral volume information.

🤖
by LeviathanCapital
Free
TradingView Indicator
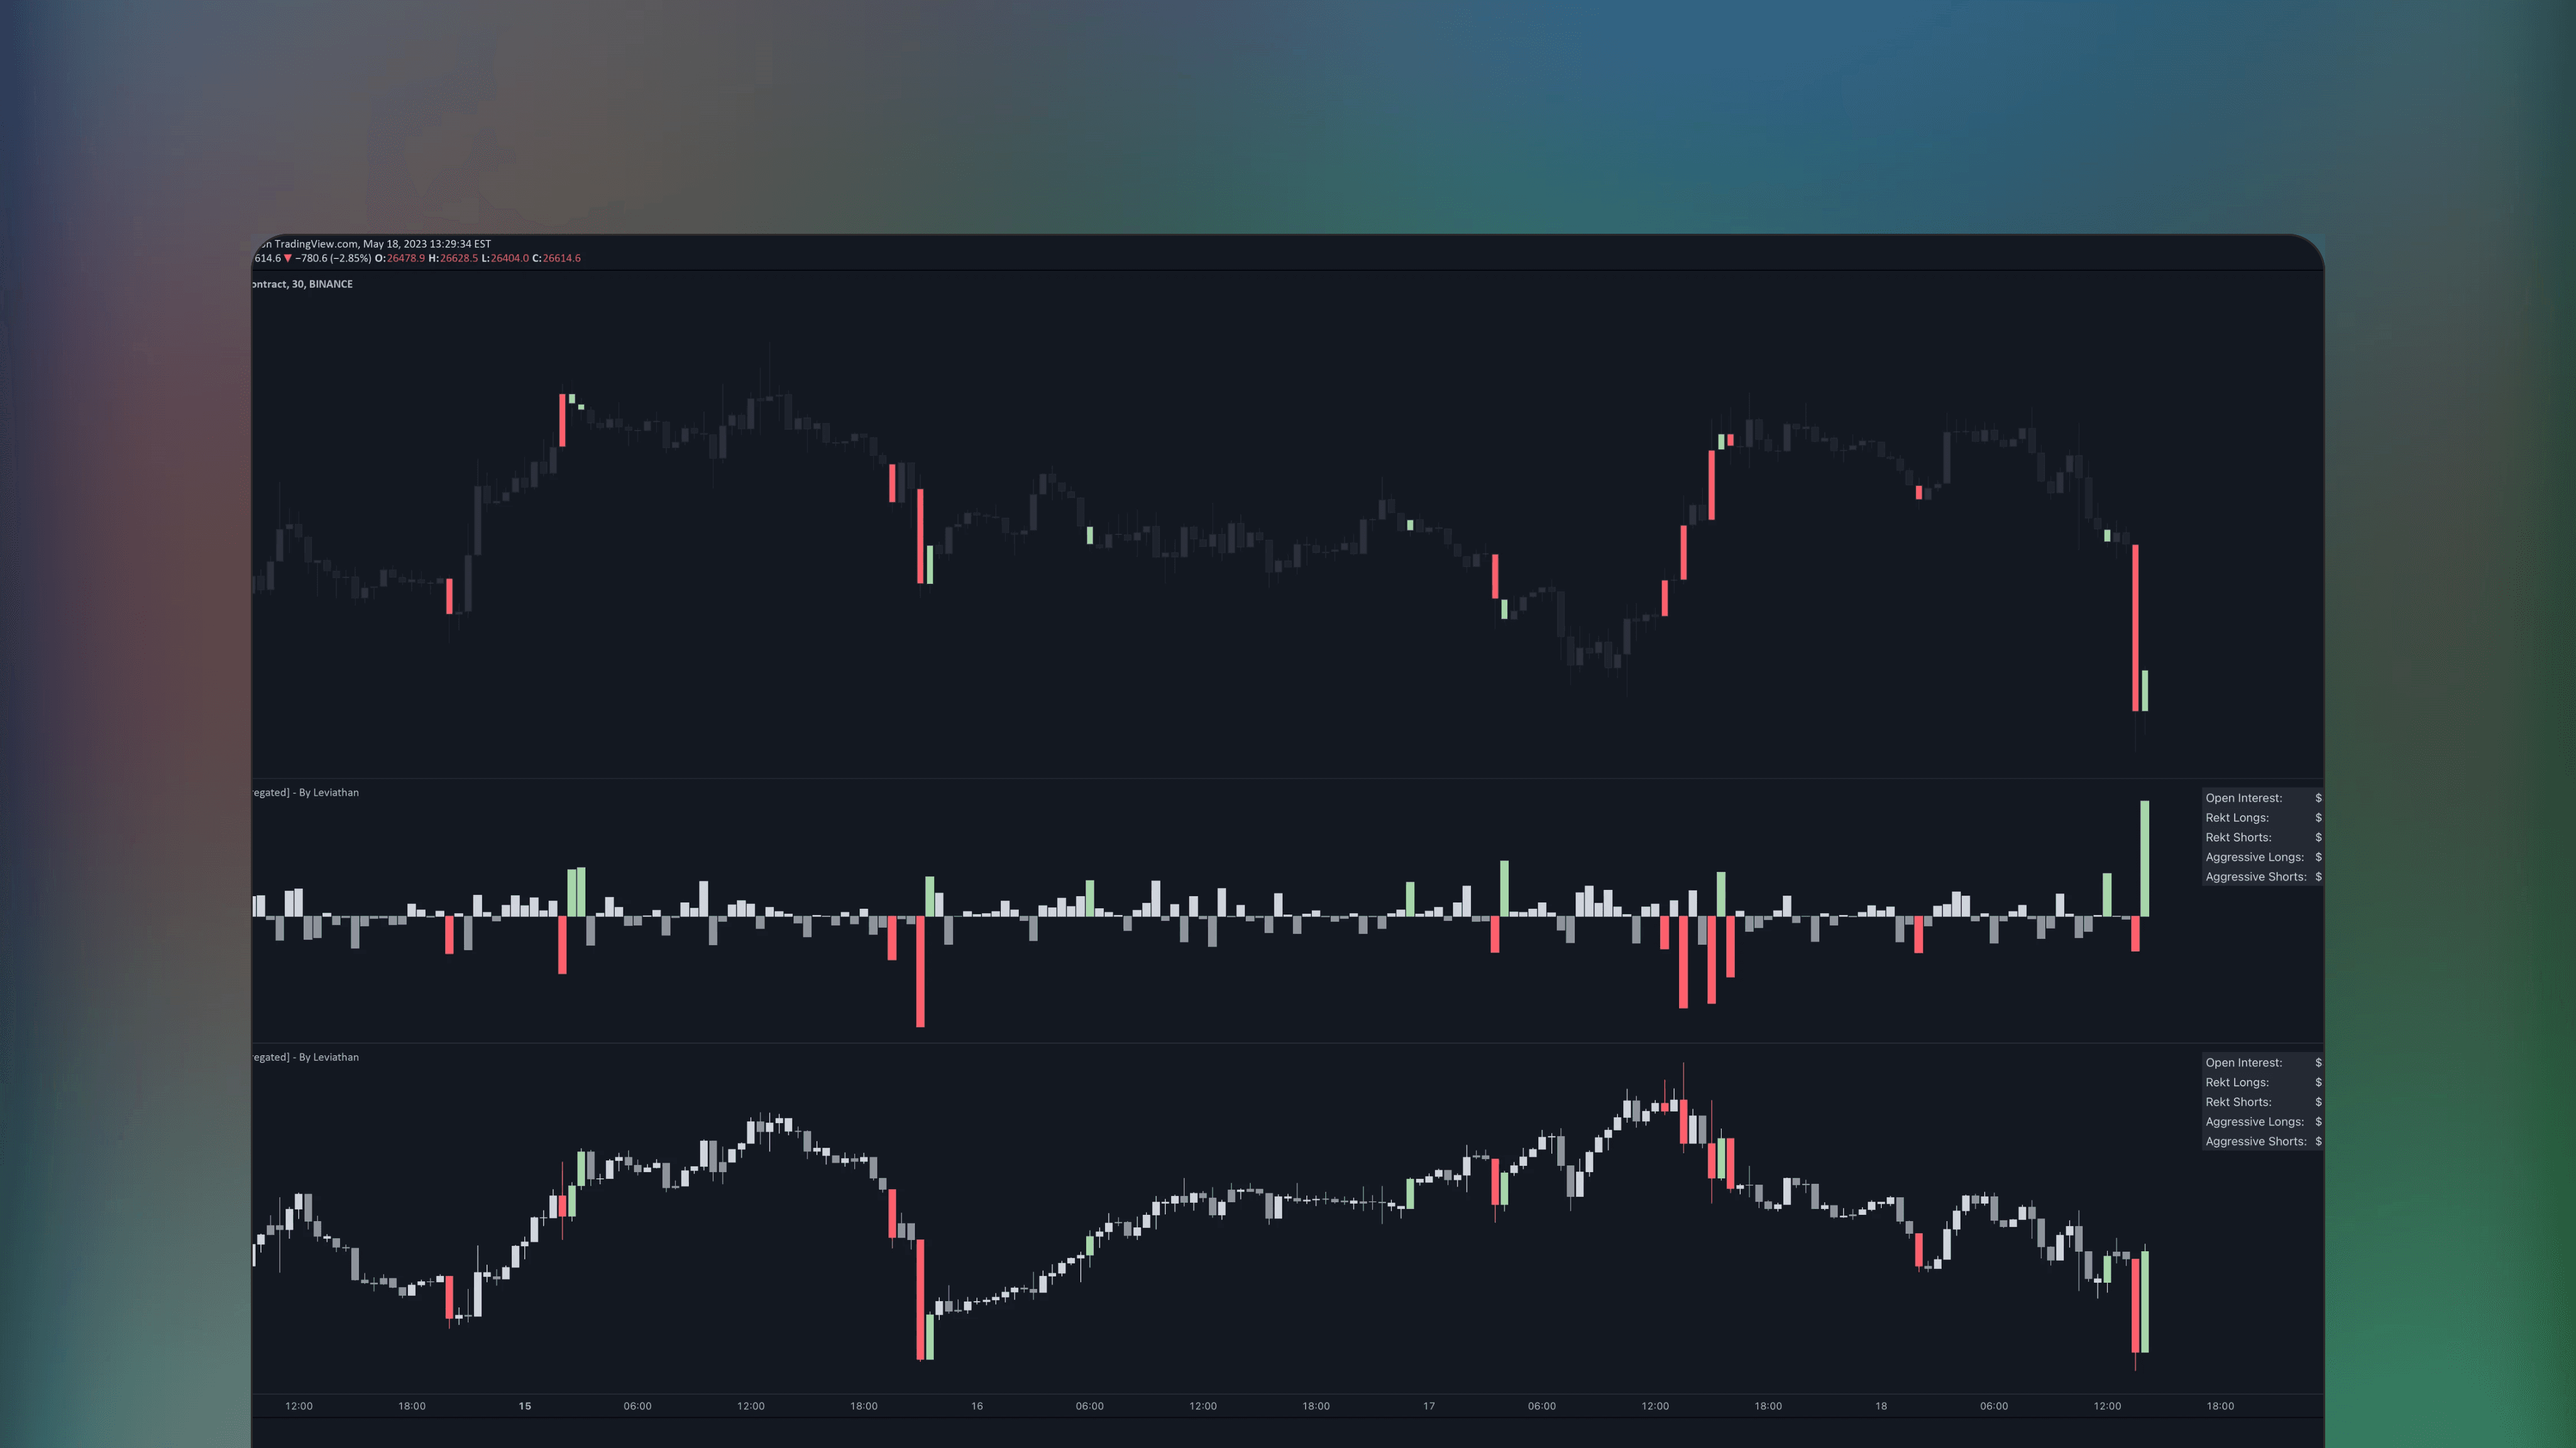
Volume Suite - By Leviathan (CVD, Volume Delta, Relative Volume)
🔑
🌐
✅
Volume Suite by Leviathan is a TradingView indicator that combines multiple volume metrics like CVD, Volume Delta, Relative Volume, Buy/Sell Volume and Cumulative Relative Volume into one single view. Offers customizable visualizations, highlighting significant volume and price anomalies.
🤖
by LeviathanCapital
Free
TradingView Indicator
Open Interest Suite [Aggregated] - By Leviathan
🔑
🌐
✅
🏅
Open Interest Suite [Aggregated] by Leviathan is an Indicator that utilizes aggregated Open Interest data to visualize market interest through OI candles, Open Interest Delta and their distribution profiles. It also features innovative metrics like OI x rVOL, OI RSI, an OI Distribution profile and a statistics screener for keeping up with the data.

🤖
by LeviathanCapital
Free
TradingView Indicator
Open Interest Profile [Fixed Range] - By Leviathan
🔑
🌐
✅
🏅
Open Interest Profile [Fixed Range] by Leviathan is a TradingView indicator that aggregates open interest data over a user-specified fixed range, offering a range of tools and metrics like OI Delta Profile, Positive Delta Levels, OI Heatmap, Range Levels, OIWAP and POCs.
🤖
by LeviathanCapital
Free
TradingView Indicator
Net Positions (Net Longs & Net Shorts) - By Leviathan
🔑
🌐
🏅
Net Positions (Net Longs & Net Shorts) by Leviathan is a free TradingView indicator that visualizes net long and short market positions using various methods. It includes tools like NL/NS Profile, Delta, Ratio, Volume Heatmap, Divergence Finder, RSI, EMAs and VWMAs. Author notes this is an experimental tool.
🤖
by KioseffTrading
Free
TradingView Indicator
Zig-Zag Volume Profile (Bull vs. Bear) [Kioseff Trading]
🔑
🌐
Zig-Zag Volume Profile (Bull vs. Bear) [Kioseff Trading] is a TradingView indicator that displays bullish and bearish volume distributions using unique Zig-Zag style visualization.

🤖
by LeviathanCapital
Free
TradingView Indicator
Open Interest Delta - By Leviathan
🔑
🌐
✅
🏅
Open Interest Delta - By Leviathan is a TradingView indicator that visualizes changes in open interest by plotting Open Interest Delta. It includes heatmap style extreme ranges and color-coded candles to highlight bars with significant increases or decreases in open interest.
🤖
by NXT2017
Free
TradingView Indicator
VolumeHeatmap | Experimental Version of Marketorders Matrix
🔑
🌐
VolumeHeatmap is a free experimental TradingView indicator that visualizes buy/sell orders in liquidity heatmap style, keeps track of changing volume dynamics and displays points of control (POC) occuring over time.

🤖
by LeviathanCapital
Free
TradingView Indicator
Volume Bars - Leviathan x Tradingriot
🔑
🌐
✅
🏅
Volume Bars - Leviathan x Tradingriot is a TradingView indicator streamlines volume analysis by coloring volume bars based on relative volume anomalies and price movement criteria to visualize key market moments, such as trend exhaustion or indecision.
🤖
by KioseffTrading
Free
TradingView Indicator
TPO Letters [Kioseff Trading]
🔑
🌐
🏅
TPO Letters [Kioseff Trading] is a free TradingView indicator that visualizes classic market profile letters separately, representing the chronological sequence of price formation for selected period.

🤖
by KioseffTrading
Free
TradingView Indicator
Rain Flow Candles
🔑
🏅
Rain Flow Candles is a TradingView indicator that aggregates volume data from lower timeframes to create a volume profile on a higher timeframe in unique rainflow style visuals, illustrating how volume is distributed across different price levels.

🤖
by EmreKb
Free
TradingView Indicator
Volume Density by EmreKb
🔑
🏅
Volume Density by EmreKb is a TradingView indicator that visualizes volume distribution within each candle using color intensity, highlighting price levels with high volume activity using more intense colors.
🤖
by dharmatech
Free
TradingView Indicator
Global Net Liquidity
🔑
✅
Global Net Liquidity is a free TradingView indicator that calculates global net liquidity by aggregating all major central banks' liquidity into one view.

🤖
by MXWLL-Capital-Trading
Free
TradingView Indicator
Genuine Liquidation Delta [Mxwll] - No Estimates
🔑
✅
🏅
Genuine Liquidation Delta [Mxwll] - No Estimates is a free TradingView indicator that displays real-time liquidation delta data for over 100 cryptocurrencies, sourced directly from a popular crypto exchange.
🤖
by Texmoonbeam
Free
TradingView Indicator
All-In-One Auto Anchored VWAPs
🔑
🌐
✅
All-In-One Auto Anchored VWAPs is a free TradingView indicator that draws multiple volume weighted average prices from various chart points, allowing customization of up to three anchored VWAPs with different anchor periods.
🤖
by tradeforopp
Free
TradingView Indicator
Volume Profile [TFO]
🔑
🌐
✅
🏅
Volume Profile [TFO] is a TradingView indicator that calculate a classical volume profile with added key featurees like points of control (POC), high volume nodes (HVN) and more.
🤖
by MXWLL-Capital-Trading
Free
TradingView Indicator
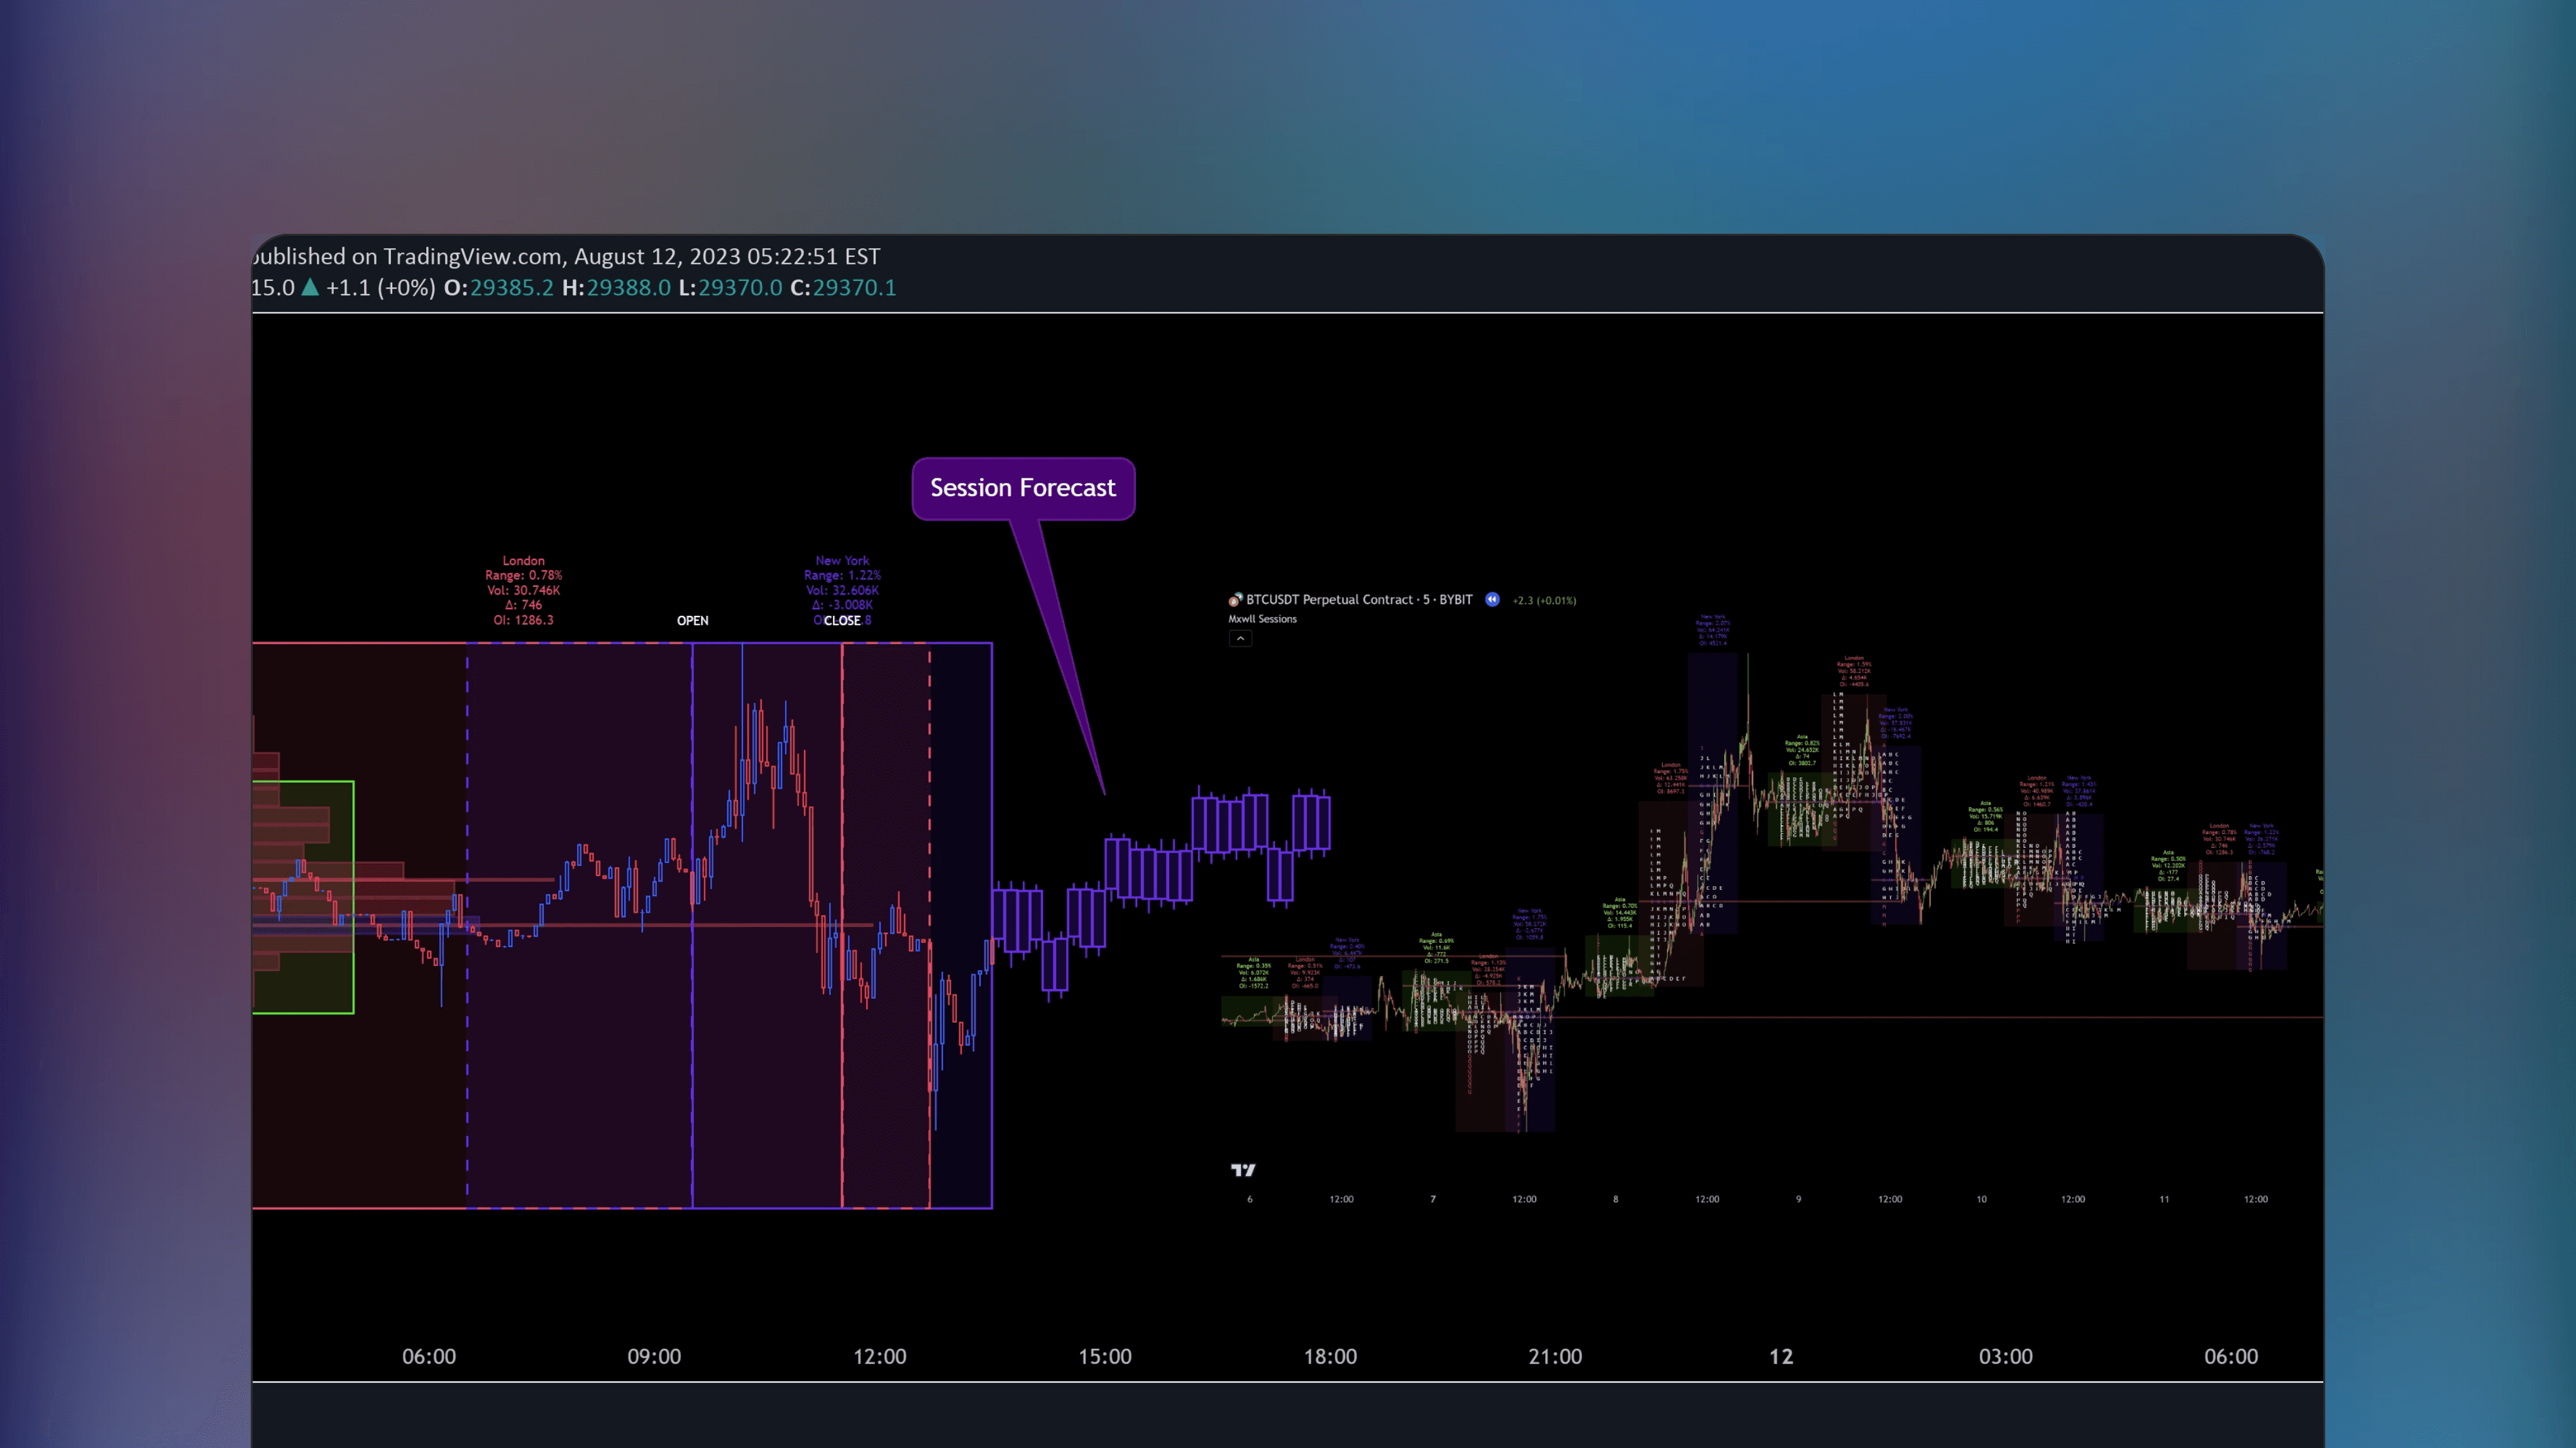
Market Sessions and TPO (+Forecast)
🔑
🌐
✅
🏅
Market Sessions and TPO (+Forecast) is a free TradingView indicator that combines market sessions based TPO profiles in lettering and bar formats, with statistical forecast for future price paths.

🤖
by TradingView
Free
TradingView Indicator
CVD - Cumulative Volume Delta (Chart)
🔑
✅
🏅
Cumulative Volume Delta (CVD) is a TradingView indicator that displays cumulative volume delta as an on-chart oscillator, using intrabar data for more precise volume analysis.
🤖
by TradingView
Free
TradingView Indicator
CVD - Cumulative Volume Delta Candles
🔑
✅
🏅
CVD - Cumulative Volume Delta Candles is displays cumulative volume delta as candlesticks using intrabar data, offering more precise volume information over a longer period of time.
🤖
by noop-noop
Free
TradingView Indicator
Market Profile Fixed View
🔑
✅
Market Profile Fixed View is a TradingView indicator that visualizes market profiles using a fixed view without relying on volume data, enabling orderflow analysis for instruments the information.

🤖
by KioseffTrading
Free
TradingView Indicator
Dynamic Liquidity Map [Kioseff Trading]
🔑
🌐
🏅
Dynamic Liquidity Map [Kioseff Trading] is a free TradingView indicator that visualizes volume and open interest deltas visualized in a heatmap style.

🤖
by Alien_Algorithms
Free
TradingView Indicator
Crypto Liquidation Heatmap
🔑
Crypto Liquidation Heatmap is a free TradingView volume indicator that uses Open Interest to estimate and display potential crypto liquidation zones at various price levels in a heatmap style. Identify high-risk liquidation areas across various crypto assets.

🤖
by MUQWISHI
Free
TradingView Indicator
Time & Sales (Tape) [By MUQWISHI]
🔑
🌐
✅
🏅
Time & Sales (Tape) [By MUQWISHI] is an Indicator that provides real-time executed trades in a tape format, including trade direction, executed price and volume traded. Updates tick-by-tick real-time or based on lower timeframes for historical values.
🤖
by KioseffTrading
Free
TradingView Indicator
Delta Ladder [Kioseff Trading]
🔑
🌐
✅
Delta Ladder [Kioseff Trading] is a free TradingView Indicator that visualizes buy and sell volume at price. This indicator presents volume delta data in various formats, such as Classic mode with volume delta based colored boxes and numeral volume information.
🤖
by LeviathanCapital
Free
TradingView Indicator
Volume Suite - By Leviathan (CVD, Volume Delta, Relative Volume)
🔑
🌐
✅
Volume Suite by Leviathan is a TradingView indicator that combines multiple volume metrics like CVD, Volume Delta, Relative Volume, Buy/Sell Volume and Cumulative Relative Volume into one single view. Offers customizable visualizations, highlighting significant volume and price anomalies.
🤖
by LeviathanCapital
Free
TradingView Indicator
Open Interest Suite [Aggregated] - By Leviathan
🔑
🌐
✅
🏅
Open Interest Suite [Aggregated] by Leviathan is an Indicator that utilizes aggregated Open Interest data to visualize market interest through OI candles, Open Interest Delta and their distribution profiles. It also features innovative metrics like OI x rVOL, OI RSI, an OI Distribution profile and a statistics screener for keeping up with the data.
🤖
by LeviathanCapital
Free
TradingView Indicator
Open Interest Profile [Fixed Range] - By Leviathan
🔑
🌐
✅
🏅
Open Interest Profile [Fixed Range] by Leviathan is a TradingView indicator that aggregates open interest data over a user-specified fixed range, offering a range of tools and metrics like OI Delta Profile, Positive Delta Levels, OI Heatmap, Range Levels, OIWAP and POCs.
🤖
by LeviathanCapital
Free
TradingView Indicator
Net Positions (Net Longs & Net Shorts) - By Leviathan
🔑
🌐
🏅
Net Positions (Net Longs & Net Shorts) by Leviathan is a free TradingView indicator that visualizes net long and short market positions using various methods. It includes tools like NL/NS Profile, Delta, Ratio, Volume Heatmap, Divergence Finder, RSI, EMAs and VWMAs. Author notes this is an experimental tool.
🤖
by KioseffTrading
Free
TradingView Indicator
Zig-Zag Volume Profile (Bull vs. Bear) [Kioseff Trading]
🔑
🌐
Zig-Zag Volume Profile (Bull vs. Bear) [Kioseff Trading] is a TradingView indicator that displays bullish and bearish volume distributions using unique Zig-Zag style visualization.
🤖
by LeviathanCapital
Free
TradingView Indicator
Open Interest Delta - By Leviathan
🔑
🌐
✅
🏅
Open Interest Delta - By Leviathan is a TradingView indicator that visualizes changes in open interest by plotting Open Interest Delta. It includes heatmap style extreme ranges and color-coded candles to highlight bars with significant increases or decreases in open interest.
🤖
by NXT2017
Free
TradingView Indicator
VolumeHeatmap | Experimental Version of Marketorders Matrix
🔑
🌐
VolumeHeatmap is a free experimental TradingView indicator that visualizes buy/sell orders in liquidity heatmap style, keeps track of changing volume dynamics and displays points of control (POC) occuring over time.
🤖
by LeviathanCapital
Free
TradingView Indicator
Volume Bars - Leviathan x Tradingriot
🔑
🌐
✅
🏅
Volume Bars - Leviathan x Tradingriot is a TradingView indicator streamlines volume analysis by coloring volume bars based on relative volume anomalies and price movement criteria to visualize key market moments, such as trend exhaustion or indecision.
🤖
by KioseffTrading
Free
TradingView Indicator
TPO Letters [Kioseff Trading]
🔑
🌐
🏅
TPO Letters [Kioseff Trading] is a free TradingView indicator that visualizes classic market profile letters separately, representing the chronological sequence of price formation for selected period.
🤖
by KioseffTrading
Free
TradingView Indicator
Rain Flow Candles
🔑
🏅
Rain Flow Candles is a TradingView indicator that aggregates volume data from lower timeframes to create a volume profile on a higher timeframe in unique rainflow style visuals, illustrating how volume is distributed across different price levels.
🤖
by EmreKb
Free
TradingView Indicator
Volume Density by EmreKb
🔑
🏅
Volume Density by EmreKb is a TradingView indicator that visualizes volume distribution within each candle using color intensity, highlighting price levels with high volume activity using more intense colors.
🤖
by dharmatech
Free
TradingView Indicator
Global Net Liquidity
🔑
✅
Global Net Liquidity is a free TradingView indicator that calculates global net liquidity by aggregating all major central banks' liquidity into one view.
🤖
by MXWLL-Capital-Trading
Free
TradingView Indicator
Genuine Liquidation Delta [Mxwll] - No Estimates
🔑
✅
🏅
Genuine Liquidation Delta [Mxwll] - No Estimates is a free TradingView indicator that displays real-time liquidation delta data for over 100 cryptocurrencies, sourced directly from a popular crypto exchange.
🤖
by Texmoonbeam
Free
TradingView Indicator
All-In-One Auto Anchored VWAPs
🔑
🌐
✅
All-In-One Auto Anchored VWAPs is a free TradingView indicator that draws multiple volume weighted average prices from various chart points, allowing customization of up to three anchored VWAPs with different anchor periods.
🤖
by tradeforopp
Free
TradingView Indicator
Volume Profile [TFO]
🔑
🌐
✅
🏅
Volume Profile [TFO] is a TradingView indicator that calculate a classical volume profile with added key featurees like points of control (POC), high volume nodes (HVN) and more.
🤖
by MXWLL-Capital-Trading
Free
TradingView Indicator
Market Sessions and TPO (+Forecast)
🔑
🌐
✅
🏅
Market Sessions and TPO (+Forecast) is a free TradingView indicator that combines market sessions based TPO profiles in lettering and bar formats, with statistical forecast for future price paths.
🤖
by TradingView
Free
TradingView Indicator
CVD - Cumulative Volume Delta (Chart)
🔑
✅
🏅
Cumulative Volume Delta (CVD) is a TradingView indicator that displays cumulative volume delta as an on-chart oscillator, using intrabar data for more precise volume analysis.
🤖
by TradingView
Free
TradingView Indicator
CVD - Cumulative Volume Delta Candles
🔑
✅
🏅
CVD - Cumulative Volume Delta Candles is displays cumulative volume delta as candlesticks using intrabar data, offering more precise volume information over a longer period of time.
🤖
by noop-noop
Free
TradingView Indicator
Market Profile Fixed View
🔑
✅
Market Profile Fixed View is a TradingView indicator that visualizes market profiles using a fixed view without relying on volume data, enabling orderflow analysis for instruments the information.
🤖
by KioseffTrading
Free
TradingView Indicator
Delta Ladder [Kioseff Trading]
🔑
🌐
✅
Delta Ladder [Kioseff Trading] is a free TradingView Indicator that visualizes buy and sell volume at price. This indicator presents volume delta data in various formats, such as Classic mode with volume delta based colored boxes and numeral volume information.
🤖
by LeviathanCapital
Free
TradingView Indicator
Volume Suite - By Leviathan (CVD, Volume Delta, Relative Volume)
🔑
🌐
✅
Volume Suite by Leviathan is a TradingView indicator that combines multiple volume metrics like CVD, Volume Delta, Relative Volume, Buy/Sell Volume and Cumulative Relative Volume into one single view. Offers customizable visualizations, highlighting significant volume and price anomalies.
🤖
by LeviathanCapital
Free
TradingView Indicator
Open Interest Suite [Aggregated] - By Leviathan
🔑
🌐
✅
🏅
Open Interest Suite [Aggregated] by Leviathan is an Indicator that utilizes aggregated Open Interest data to visualize market interest through OI candles, Open Interest Delta and their distribution profiles. It also features innovative metrics like OI x rVOL, OI RSI, an OI Distribution profile and a statistics screener for keeping up with the data.
🤖
by LeviathanCapital
Free
TradingView Indicator
Open Interest Profile [Fixed Range] - By Leviathan
🔑
🌐
✅
🏅
Open Interest Profile [Fixed Range] by Leviathan is a TradingView indicator that aggregates open interest data over a user-specified fixed range, offering a range of tools and metrics like OI Delta Profile, Positive Delta Levels, OI Heatmap, Range Levels, OIWAP and POCs.
🤖
by LeviathanCapital
Free
TradingView Indicator
Net Positions (Net Longs & Net Shorts) - By Leviathan
🔑
🌐
🏅
Net Positions (Net Longs & Net Shorts) by Leviathan is a free TradingView indicator that visualizes net long and short market positions using various methods. It includes tools like NL/NS Profile, Delta, Ratio, Volume Heatmap, Divergence Finder, RSI, EMAs and VWMAs. Author notes this is an experimental tool.
🤖
by KioseffTrading
Free
TradingView Indicator
Zig-Zag Volume Profile (Bull vs. Bear) [Kioseff Trading]
🔑
🌐
Zig-Zag Volume Profile (Bull vs. Bear) [Kioseff Trading] is a TradingView indicator that displays bullish and bearish volume distributions using unique Zig-Zag style visualization.
🤖
by LeviathanCapital
Free
TradingView Indicator
Open Interest Delta - By Leviathan
🔑
🌐
✅
🏅
Open Interest Delta - By Leviathan is a TradingView indicator that visualizes changes in open interest by plotting Open Interest Delta. It includes heatmap style extreme ranges and color-coded candles to highlight bars with significant increases or decreases in open interest.
🤖
by NXT2017
Free
TradingView Indicator
VolumeHeatmap | Experimental Version of Marketorders Matrix
🔑
🌐
VolumeHeatmap is a free experimental TradingView indicator that visualizes buy/sell orders in liquidity heatmap style, keeps track of changing volume dynamics and displays points of control (POC) occuring over time.
🤖
by LeviathanCapital
Free
TradingView Indicator
Volume Bars - Leviathan x Tradingriot
🔑
🌐
✅
🏅
Volume Bars - Leviathan x Tradingriot is a TradingView indicator streamlines volume analysis by coloring volume bars based on relative volume anomalies and price movement criteria to visualize key market moments, such as trend exhaustion or indecision.
🤖
by KioseffTrading
Free
TradingView Indicator
TPO Letters [Kioseff Trading]
🔑
🌐
🏅
TPO Letters [Kioseff Trading] is a free TradingView indicator that visualizes classic market profile letters separately, representing the chronological sequence of price formation for selected period.
Discover trading edge
Discover trading edge
Indicators, Platforms & Education
Indicators, Platforms & Education
TradersList
Discover trading edge
Join Telegram
Weekly listings
Join Telegram
Disclaimer
Our goal is to achieve greater transparency, guidance and safety in trading and investing by providing means to discover, research and discuss trading/investing related sites/services.
Content provided on this site is not financial advice, meant for educational purposes only. TradersList does not endorse or guarantee any result for listed sites/services. Do your own research.
Read full disclaimer
TradersList
Discover trading edge
Join Telegram
Disclaimer
Our goal is to achieve greater transparency, guidance and safety in trading and investing by providing means to discover, research and discuss trading/investing related sites/services.
Content provided on this site is not financial advice, meant for educational purposes only. TradersList does not endorse or guarantee any result for listed sites/services. Do your own research.
Read full disclaimer