

From TradersList Editors
From TradersList Editors
Analyze market patterns with this free TradingView indicator to optimize trading strategies by identifying peak and trough times of day.
Analyze market patterns with this free TradingView indicator to optimize trading strategies by identifying peak and trough times of day.


TradingView Indicator
TradingView Indicator
Statistical Tops & Bottoms Indicator for Free on TradingView
Statistical Tops & Bottoms Indicator for Free on TradingView
by sbtnc on TradingView
by sbtnc on TradingView
by sbtnc on TradingView
🤖
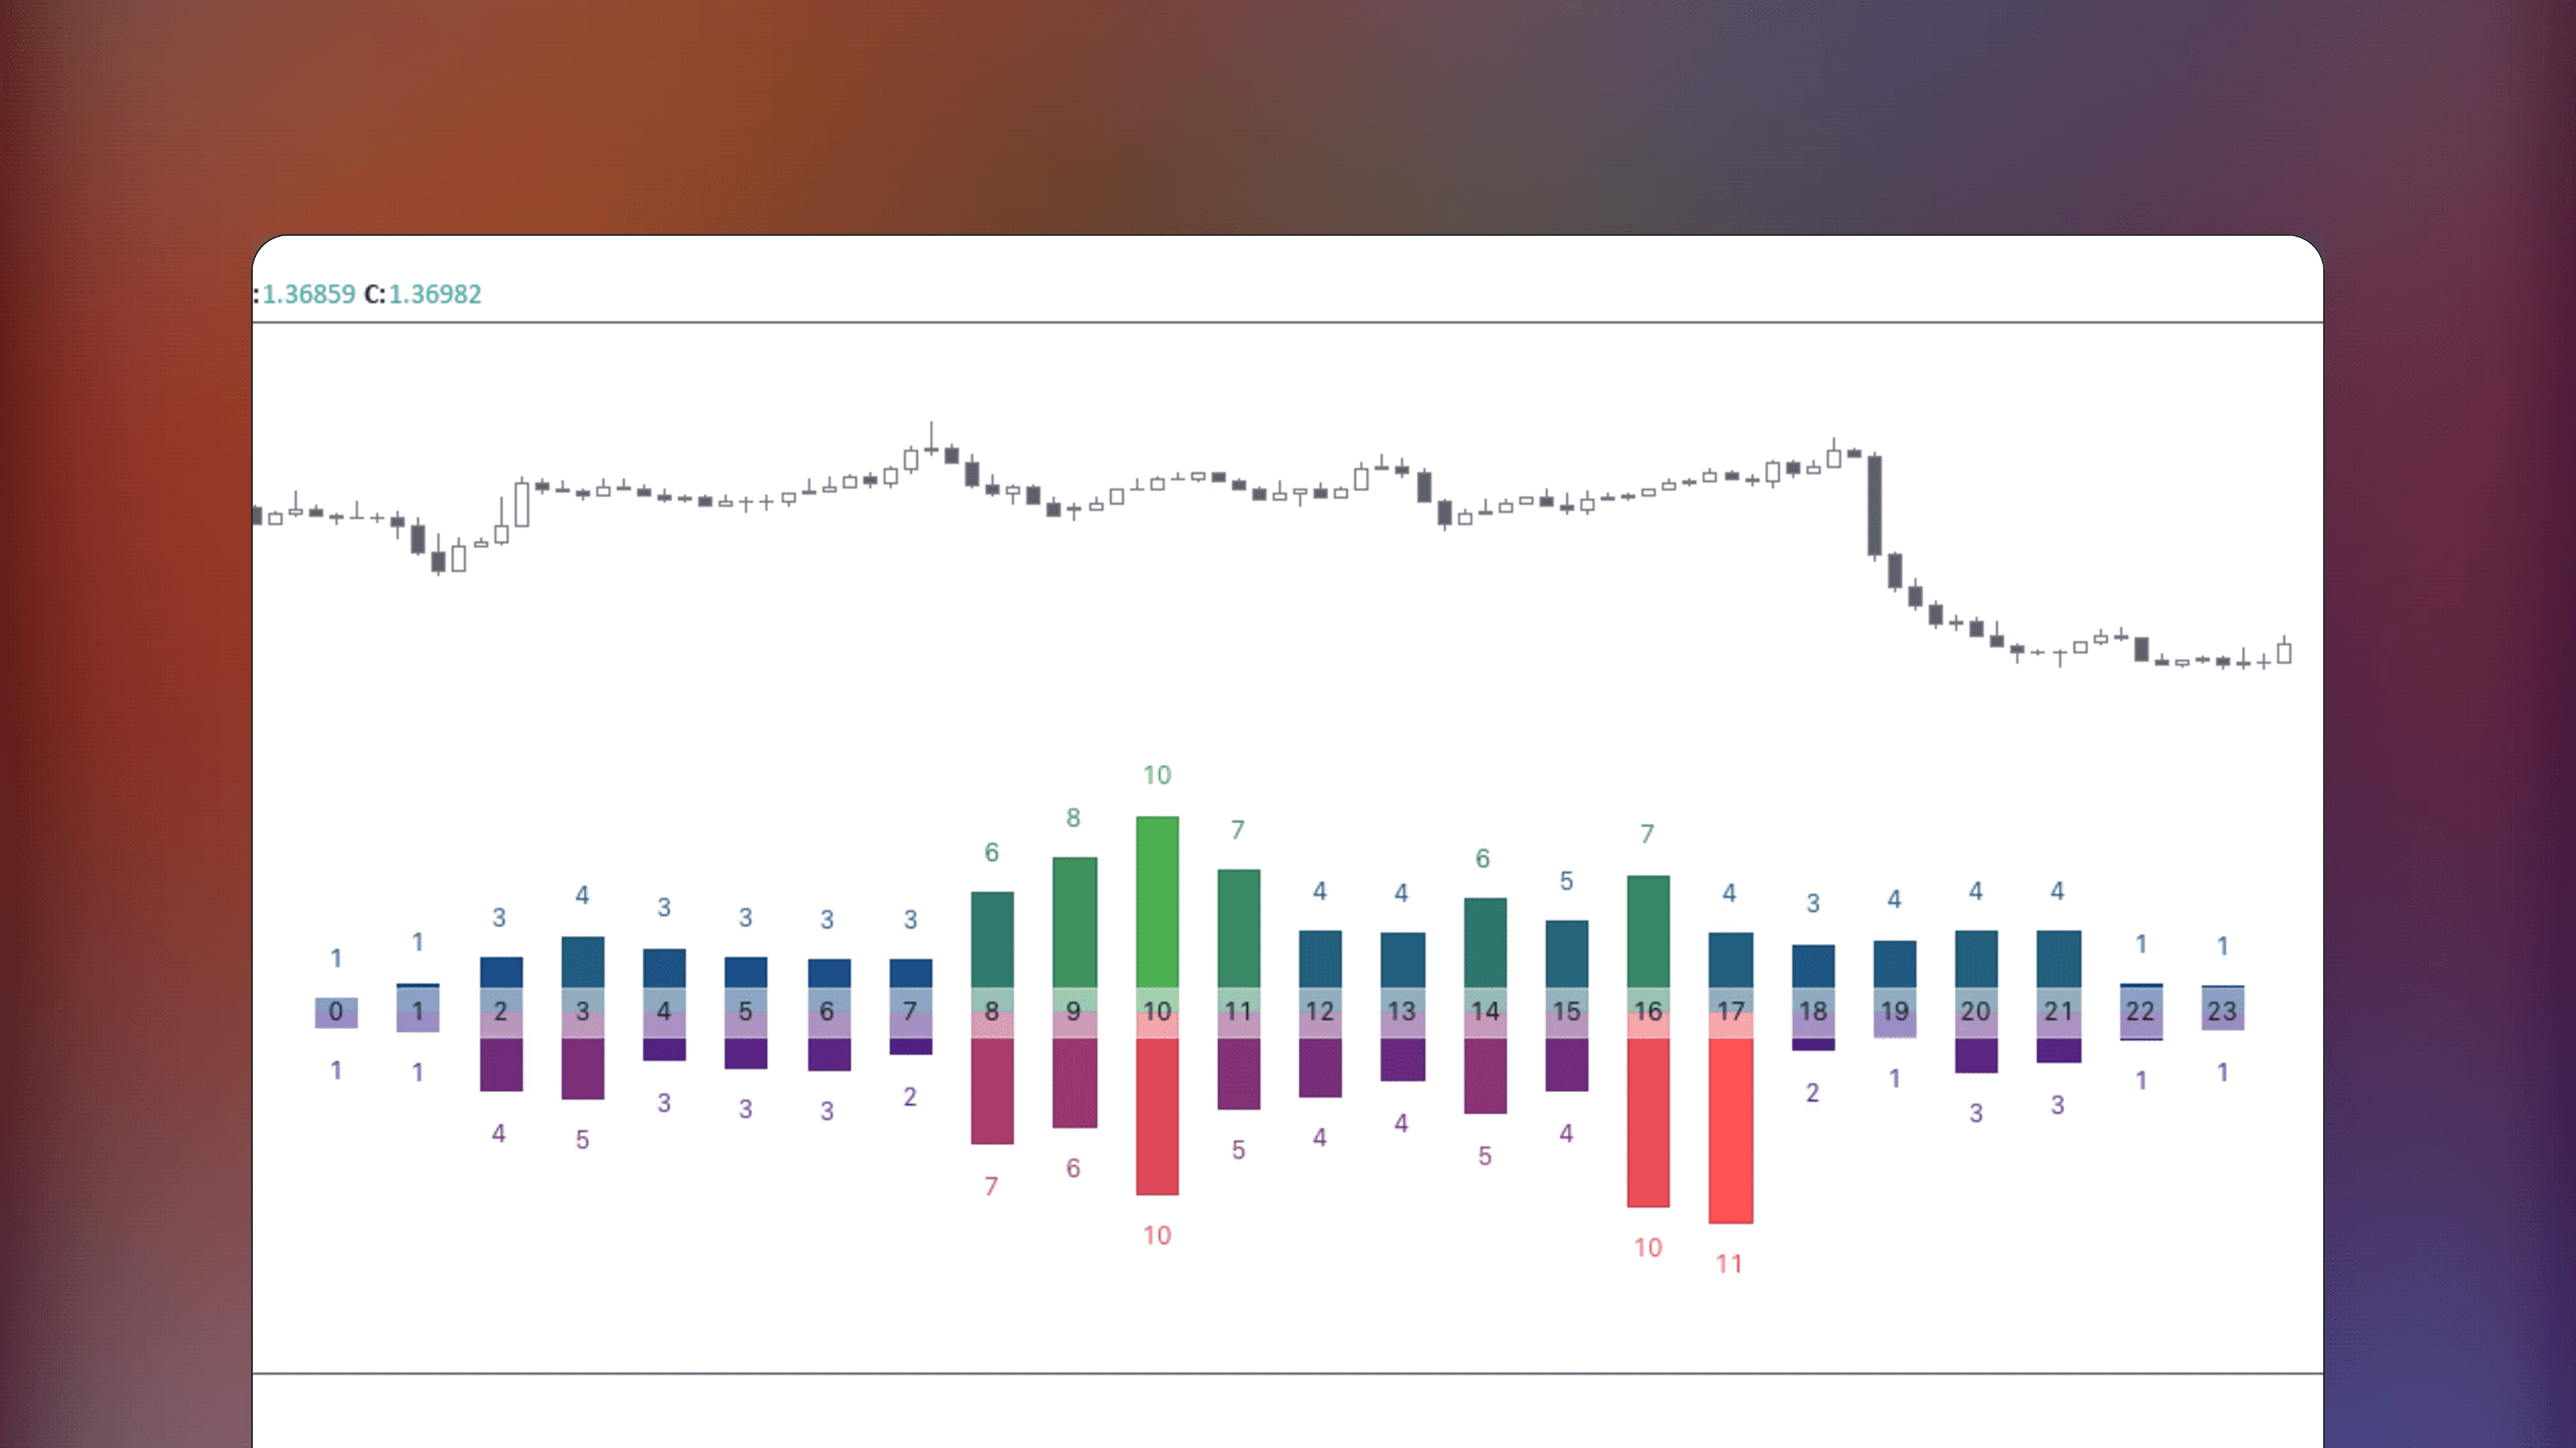
Tops & Bottoms - Time of Day Report
Tops & Bottoms - Time of Day Report
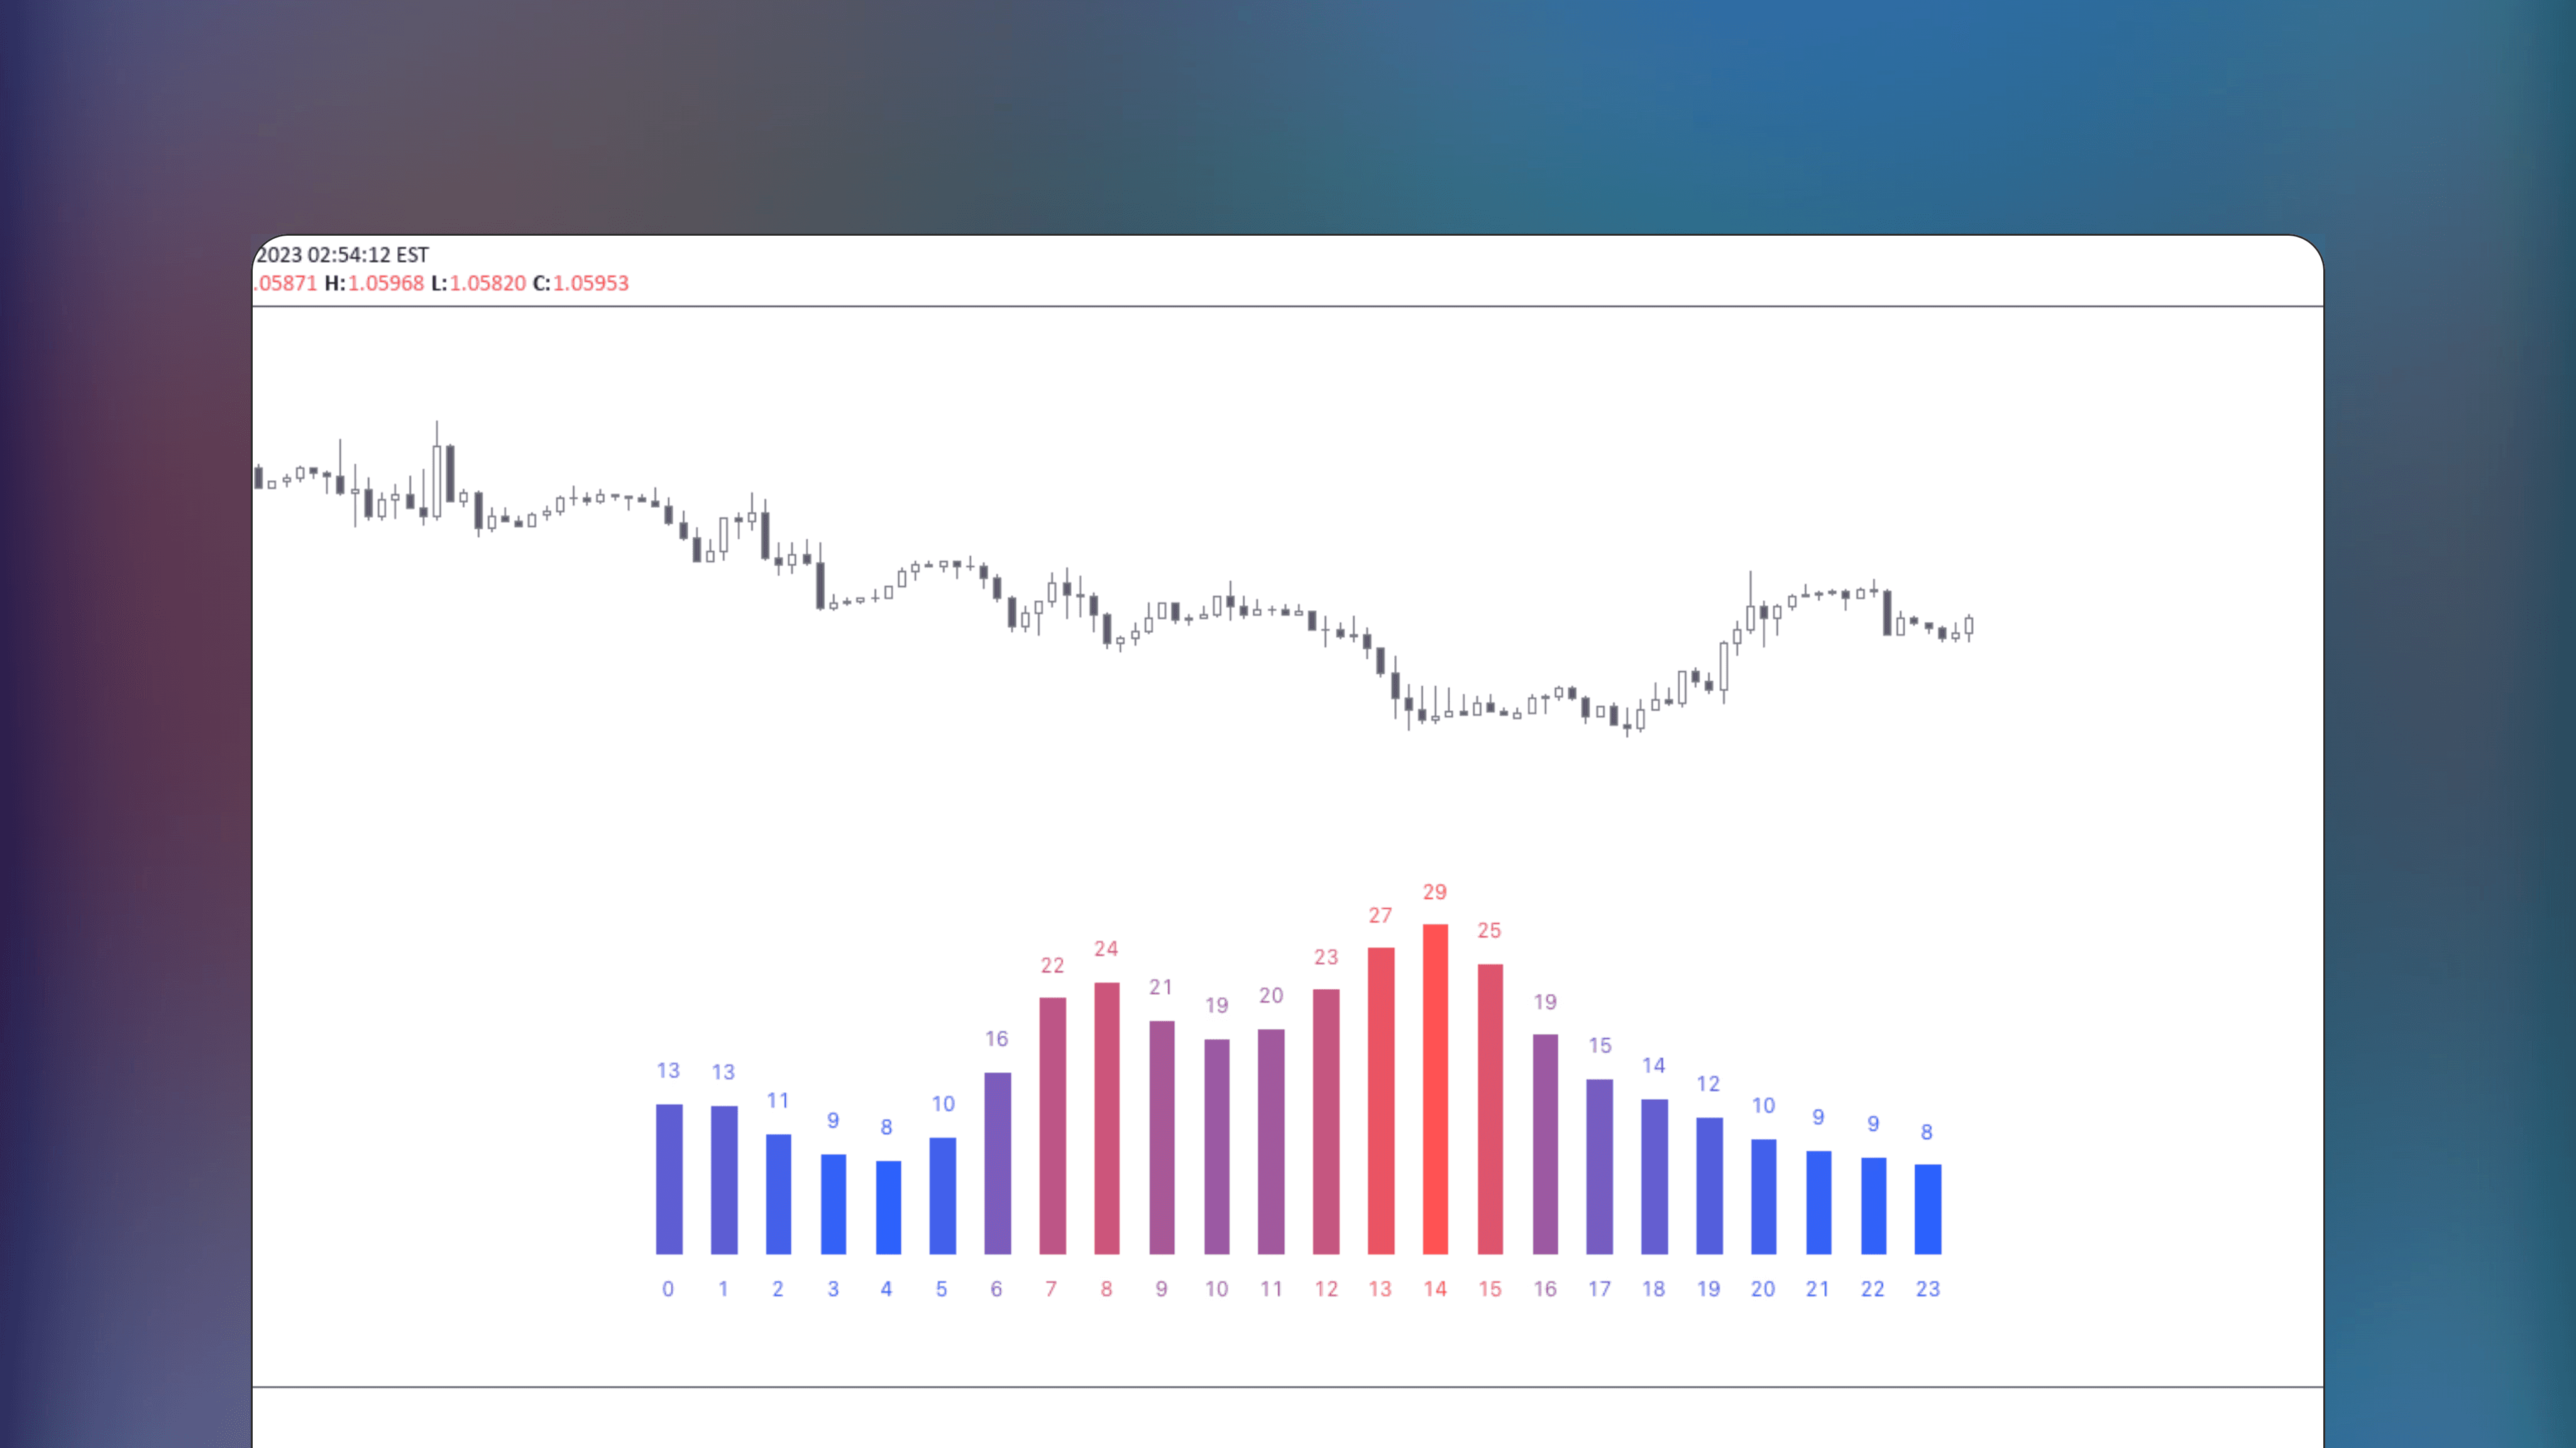
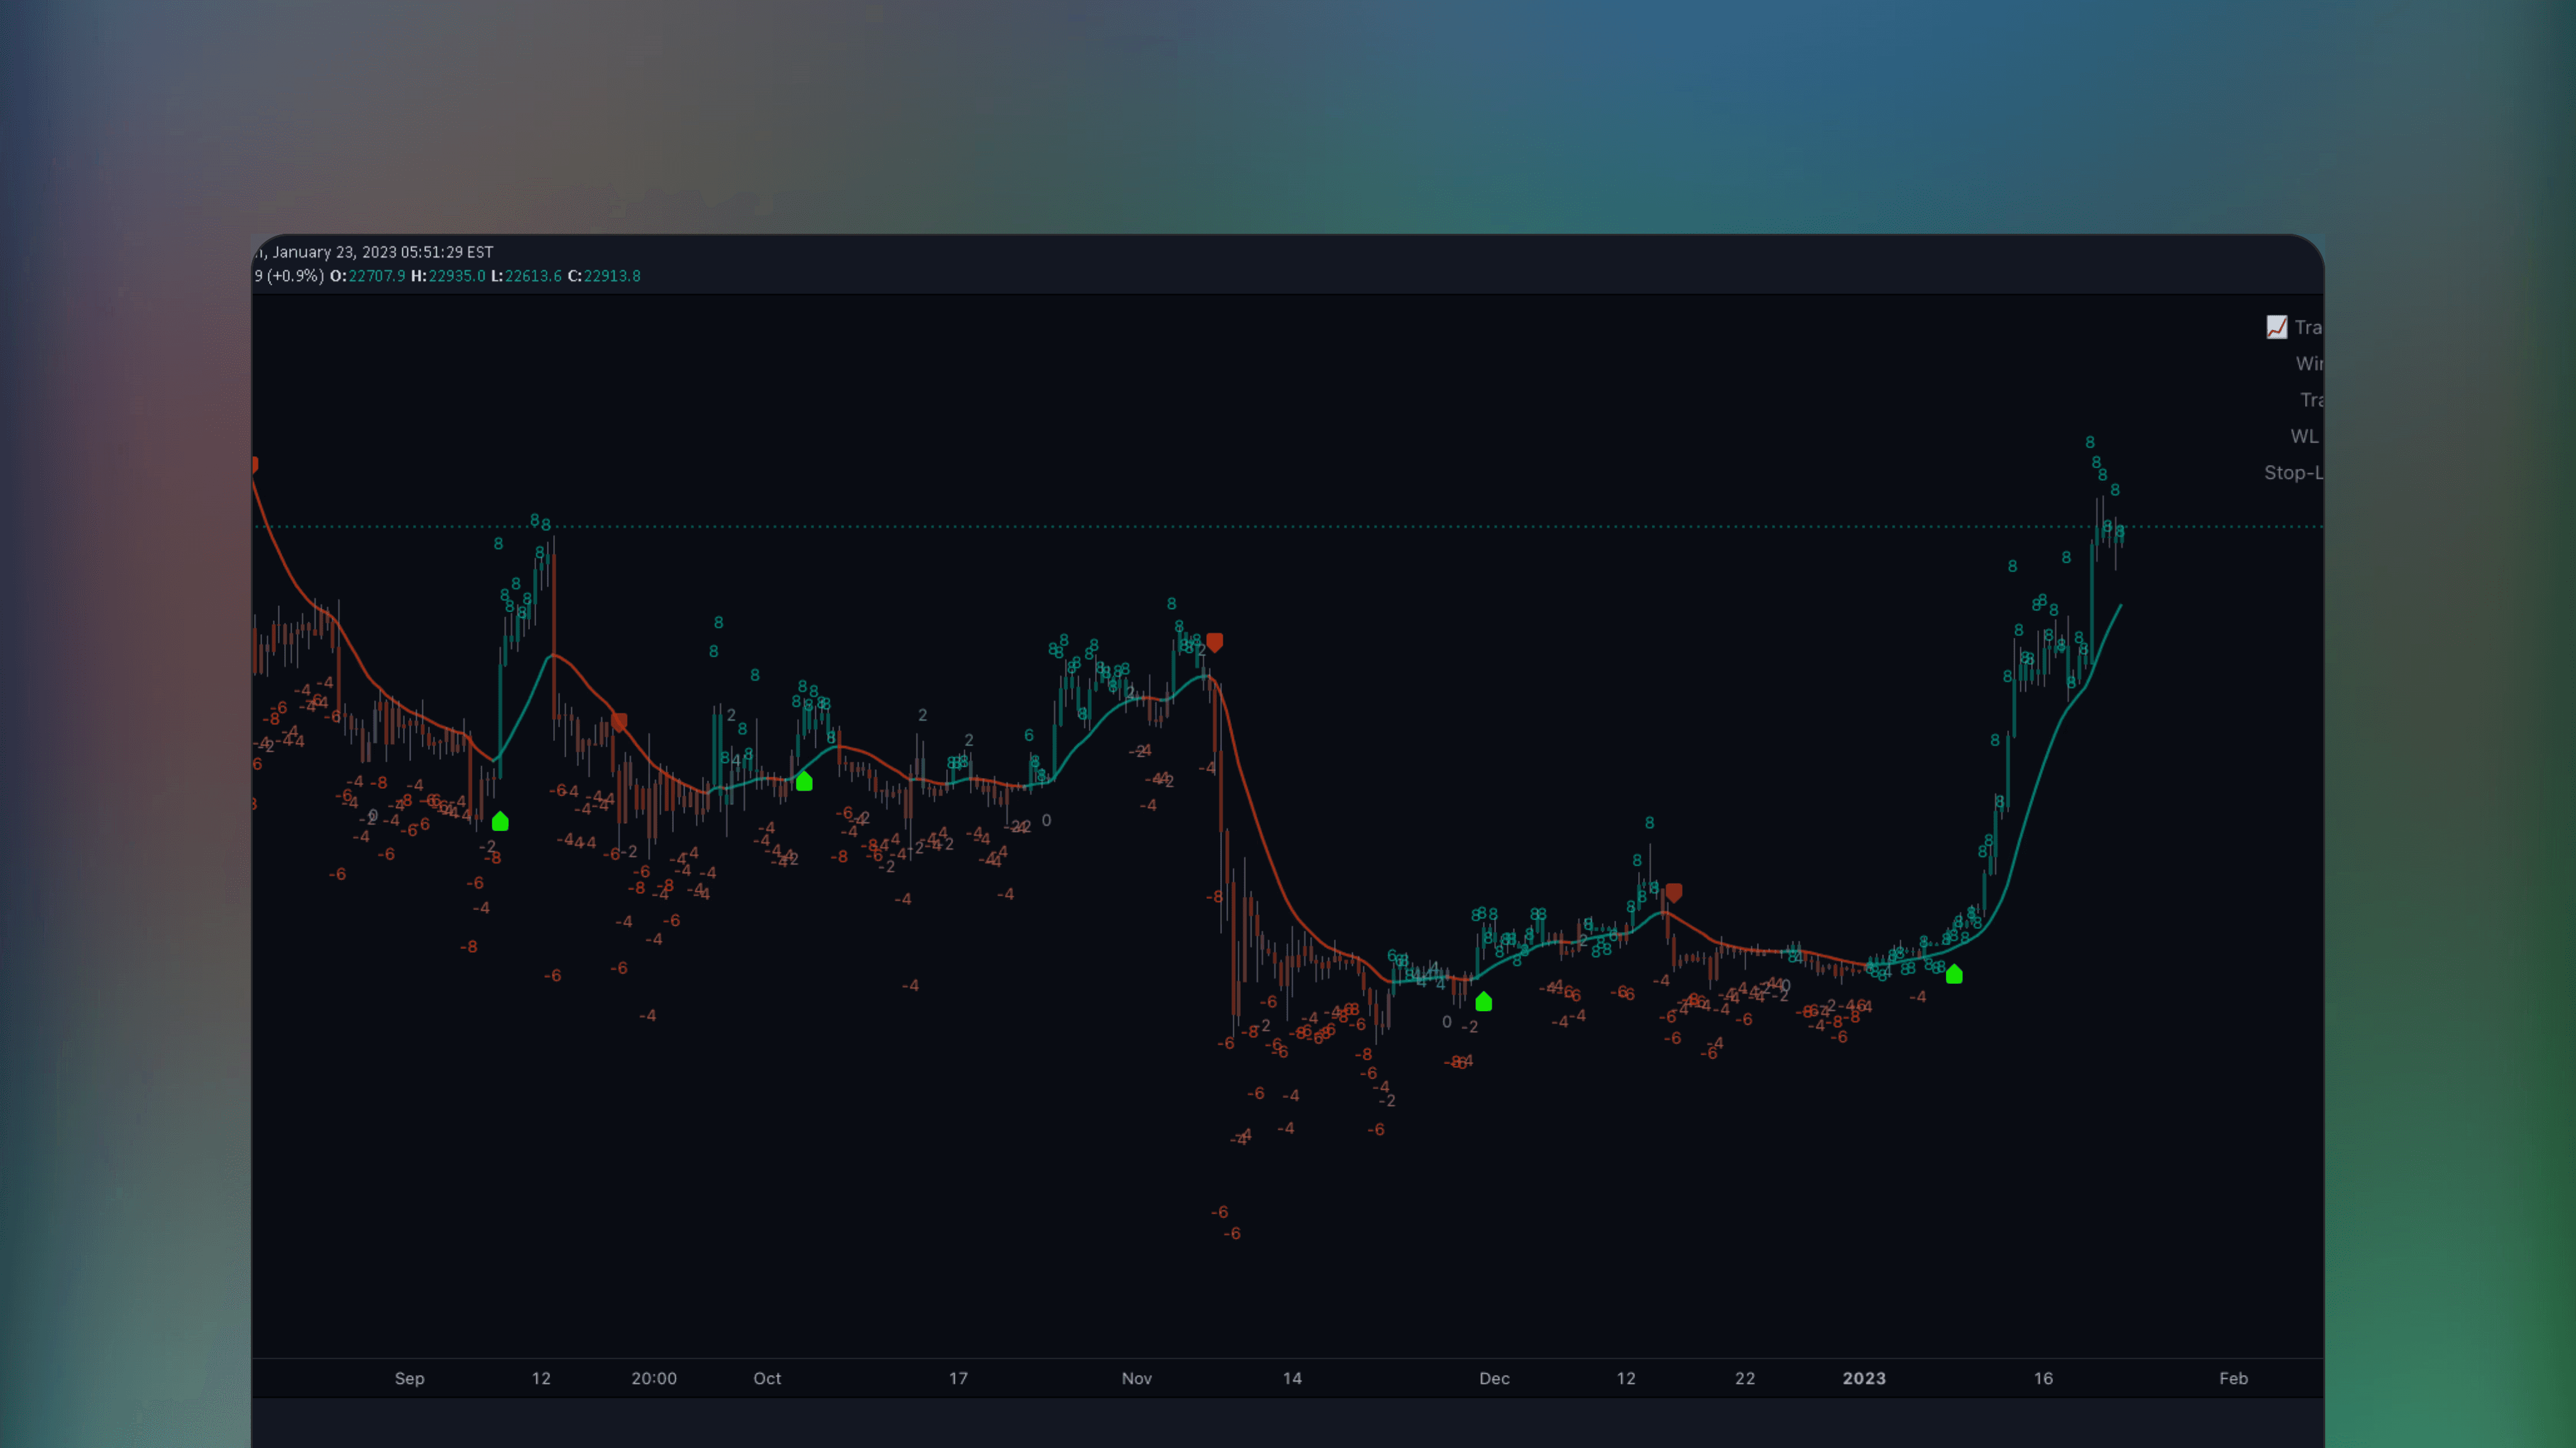
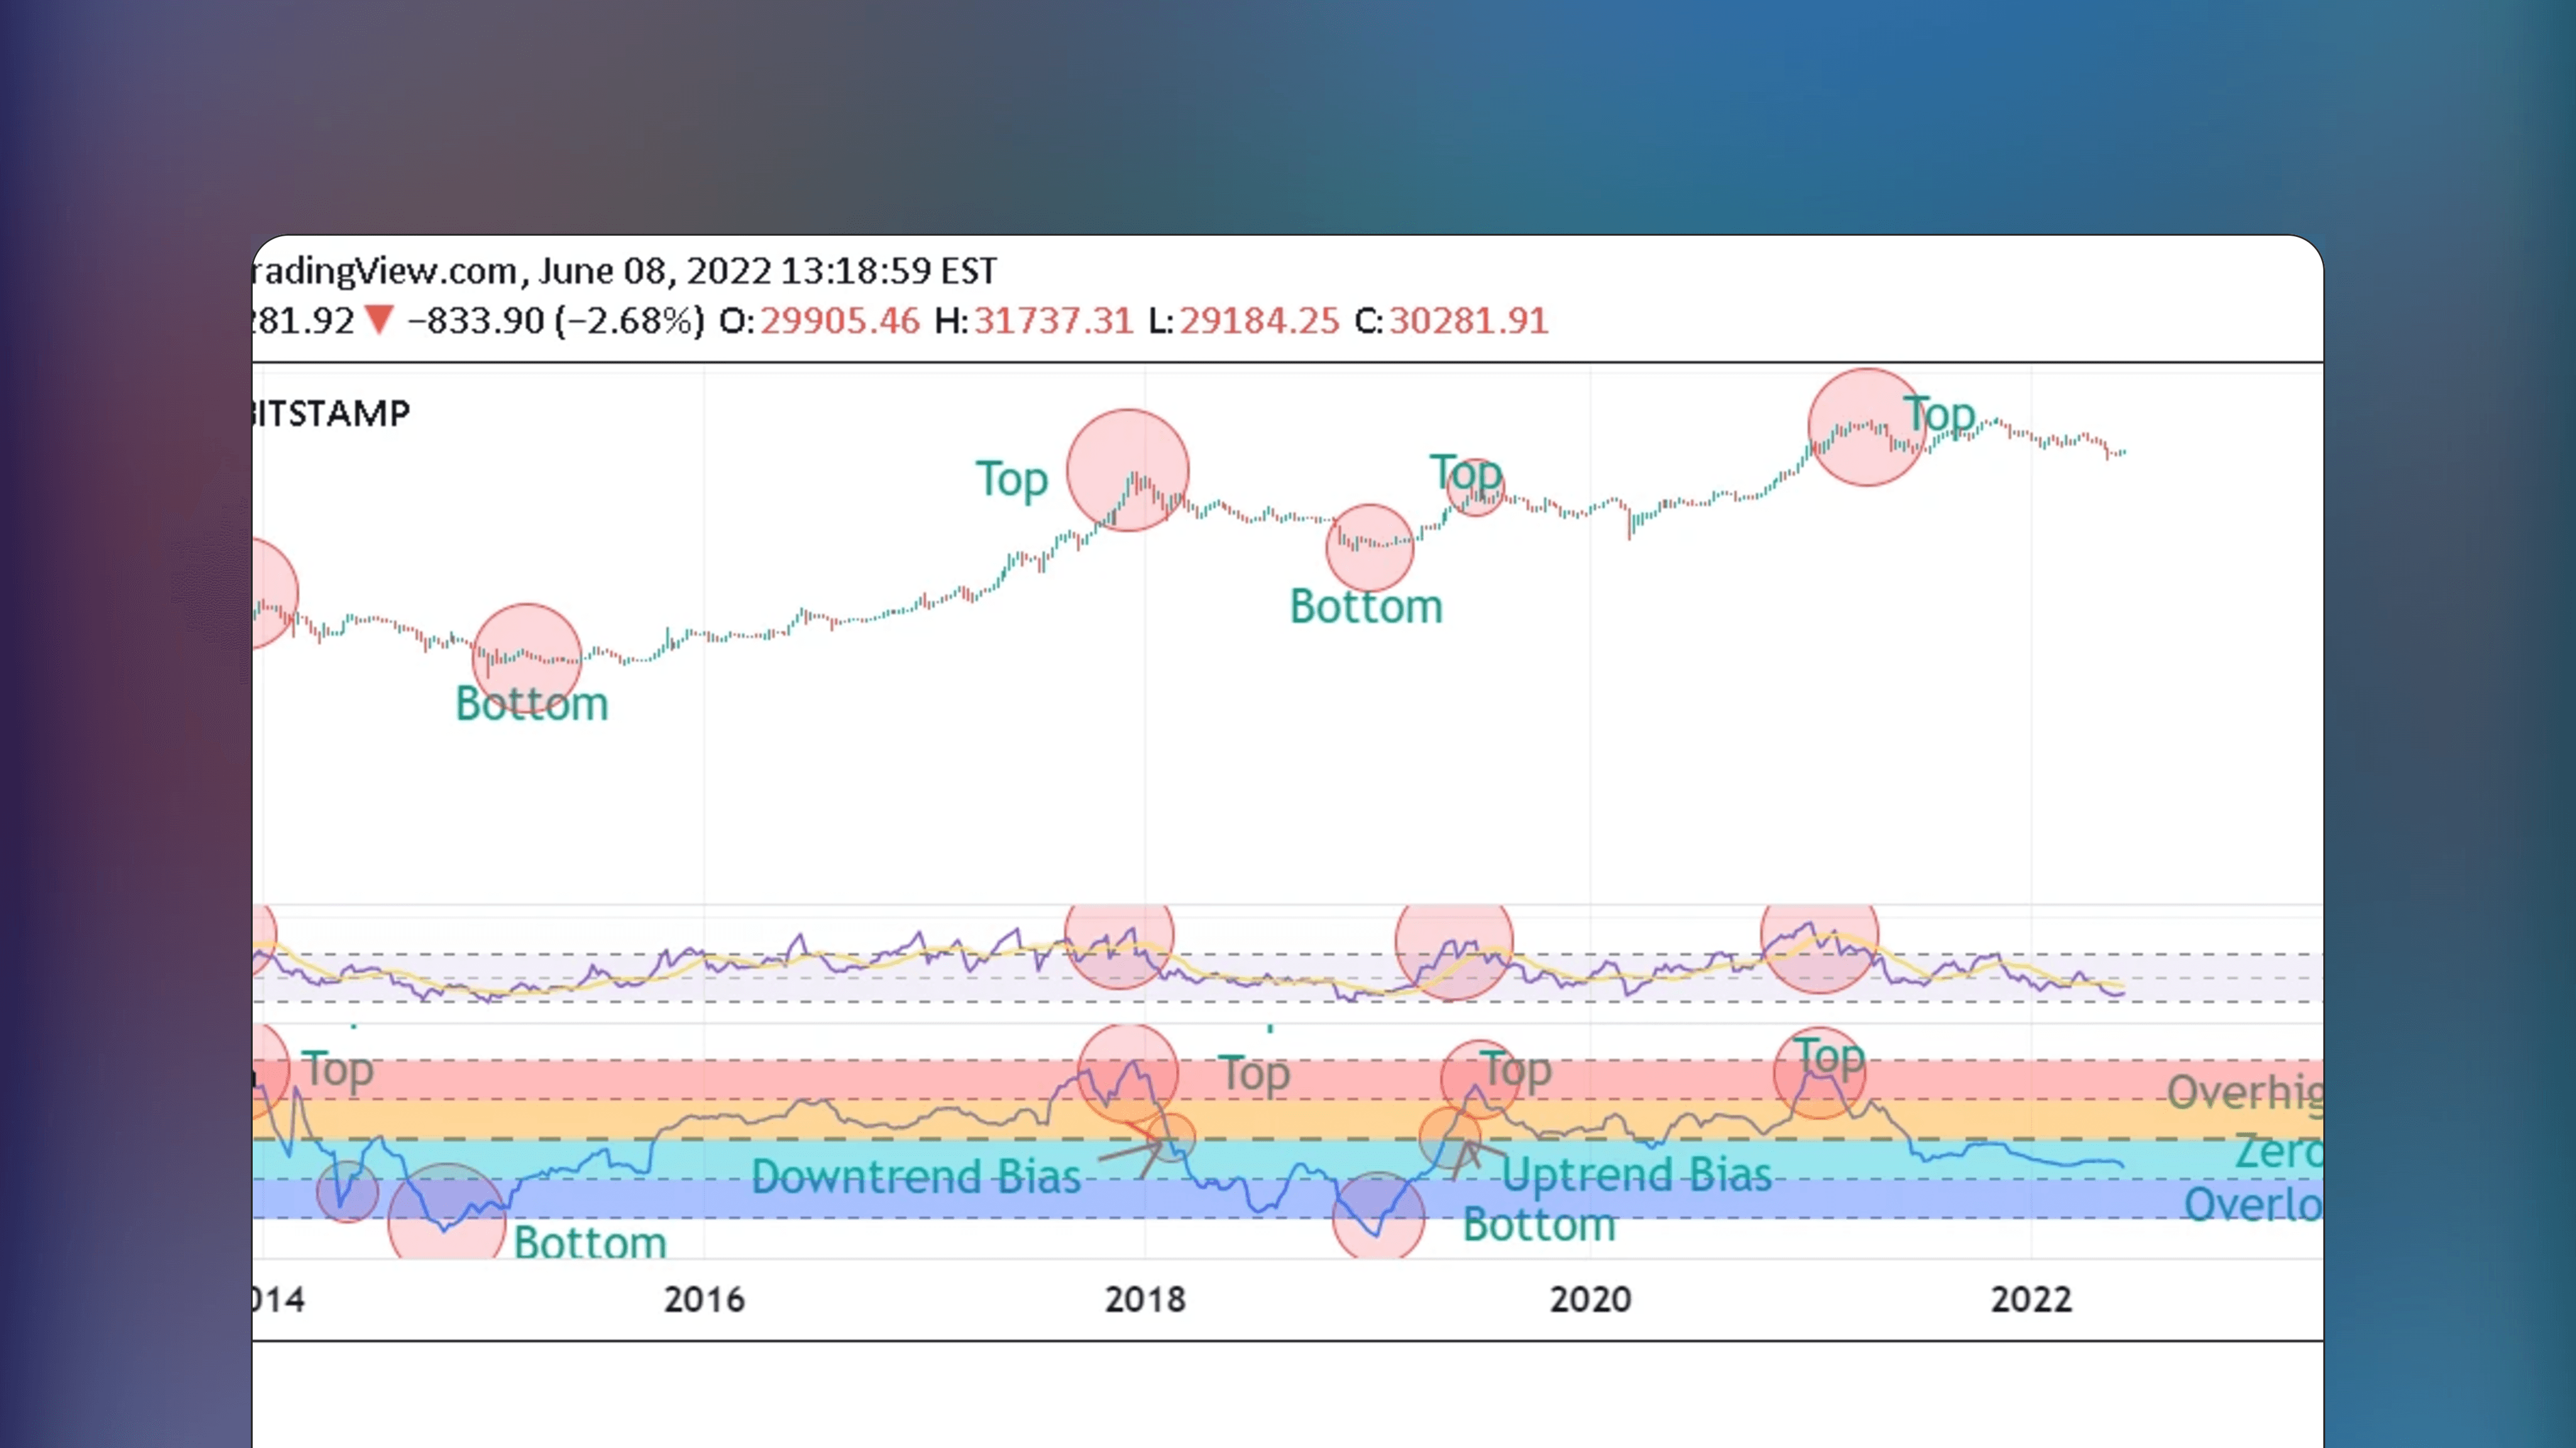
Tops & Bottoms - Time of Day Report is an Indicator that tracks and reports daily market tops and bottoms by time of day, analyzing their timing and frequency for statistical edge based on simple time periods.
Tops & Bottoms - Time of Day Report is an Indicator that tracks and reports daily market tops and bottoms by time of day, analyzing their timing and frequency for statistical edge based on simple time periods.
Get on TradingView
This indicator is available on TradingView web charting platform. Signing up for a free account is required, no downloads.
Get on TradingView
This indicator is available on TradingView web charting platform. Signing up for a free account is required, no downloads.
🔑
Open Source
Listing has publically available source code that can be audited and modified as needed.
🔑
Open Source
Listing has publically available source code that can be audited and modified as needed.
💸
Free Access
All features of this listing are fully free to use with no pricing tiers. Simply start using.
💸
Free Access
All features of this listing are fully free to use with no pricing tiers. Simply start using.
✅
Robust Theory
Concepts and theories mentioned in listing are based on generally approved and well established notions.
✅
Robust Theory
Concepts and theories mentioned in listing are based on generally approved and well established notions.
🌐
Popular Topic
Concepts and theories mentioned in listing are popular topics in web search
🌐
Popular Topic
Concepts and theories mentioned in listing are popular topics in web search
Published by sbtnc on TradingView
Published by sbtnc on TradingView
Featured Dec 6, 2024
Featured Dec 6, 2024
Statistical edge into time and price
Statistical edge into time and price
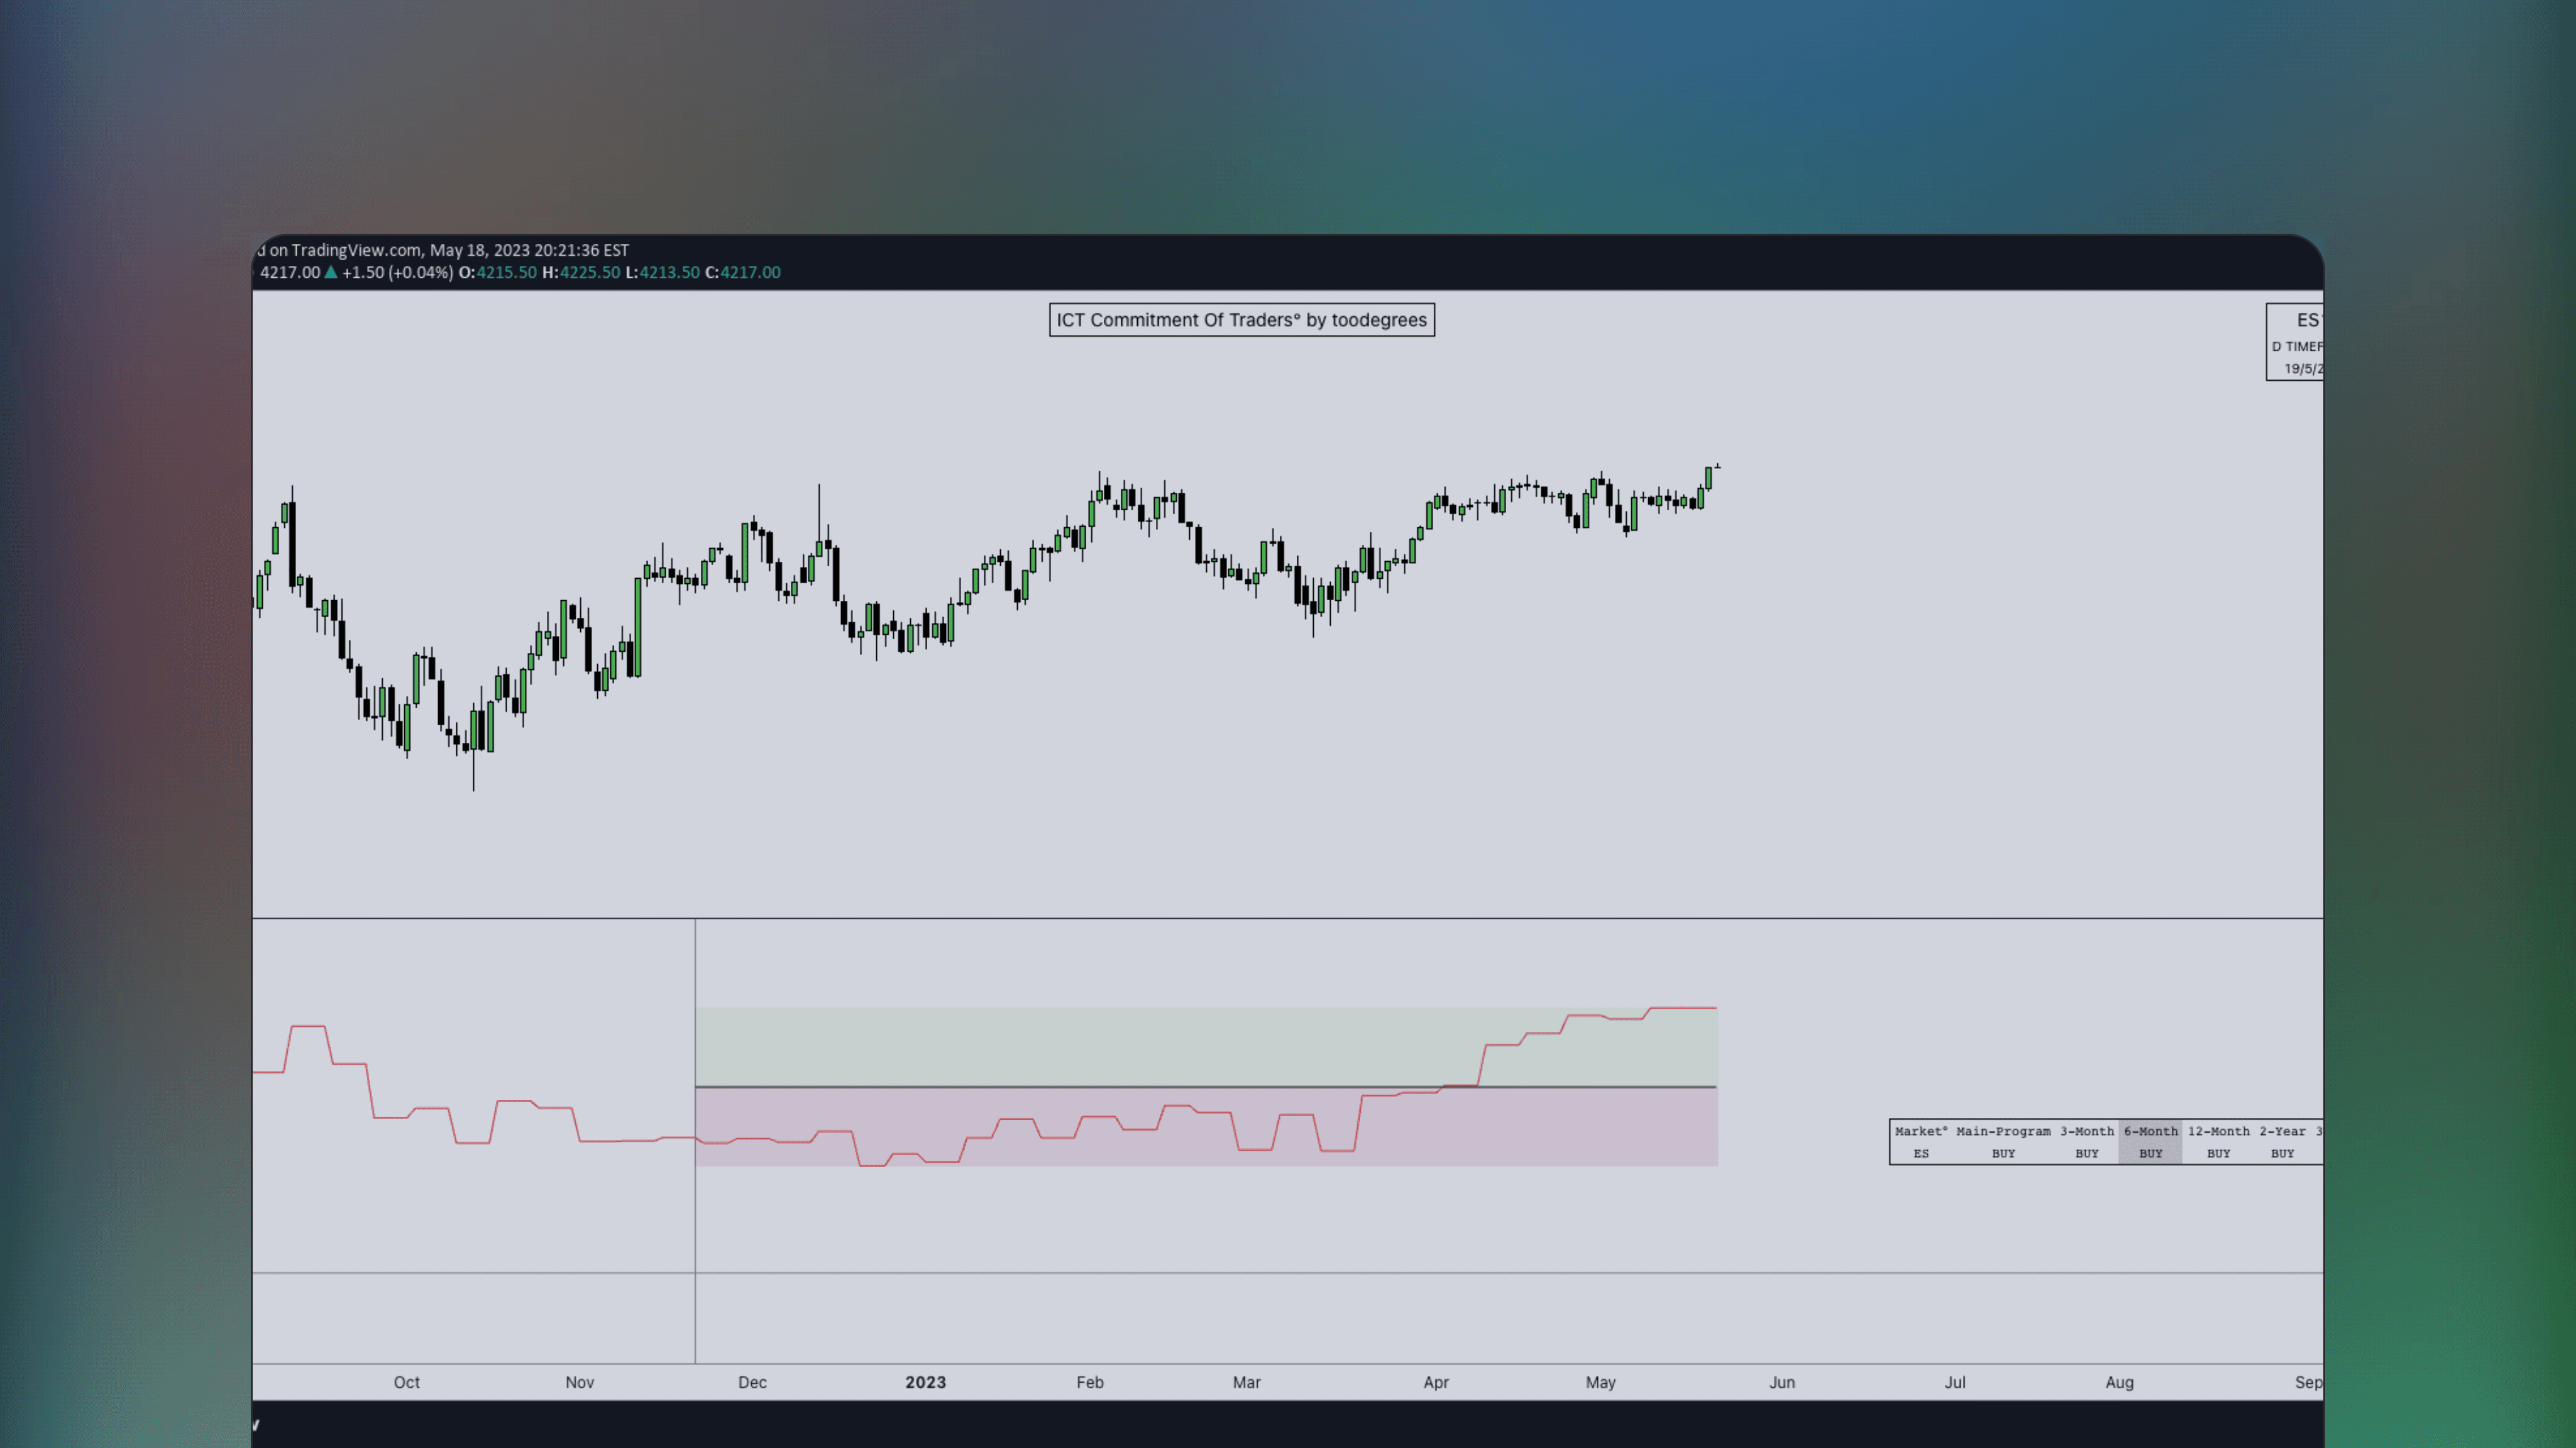
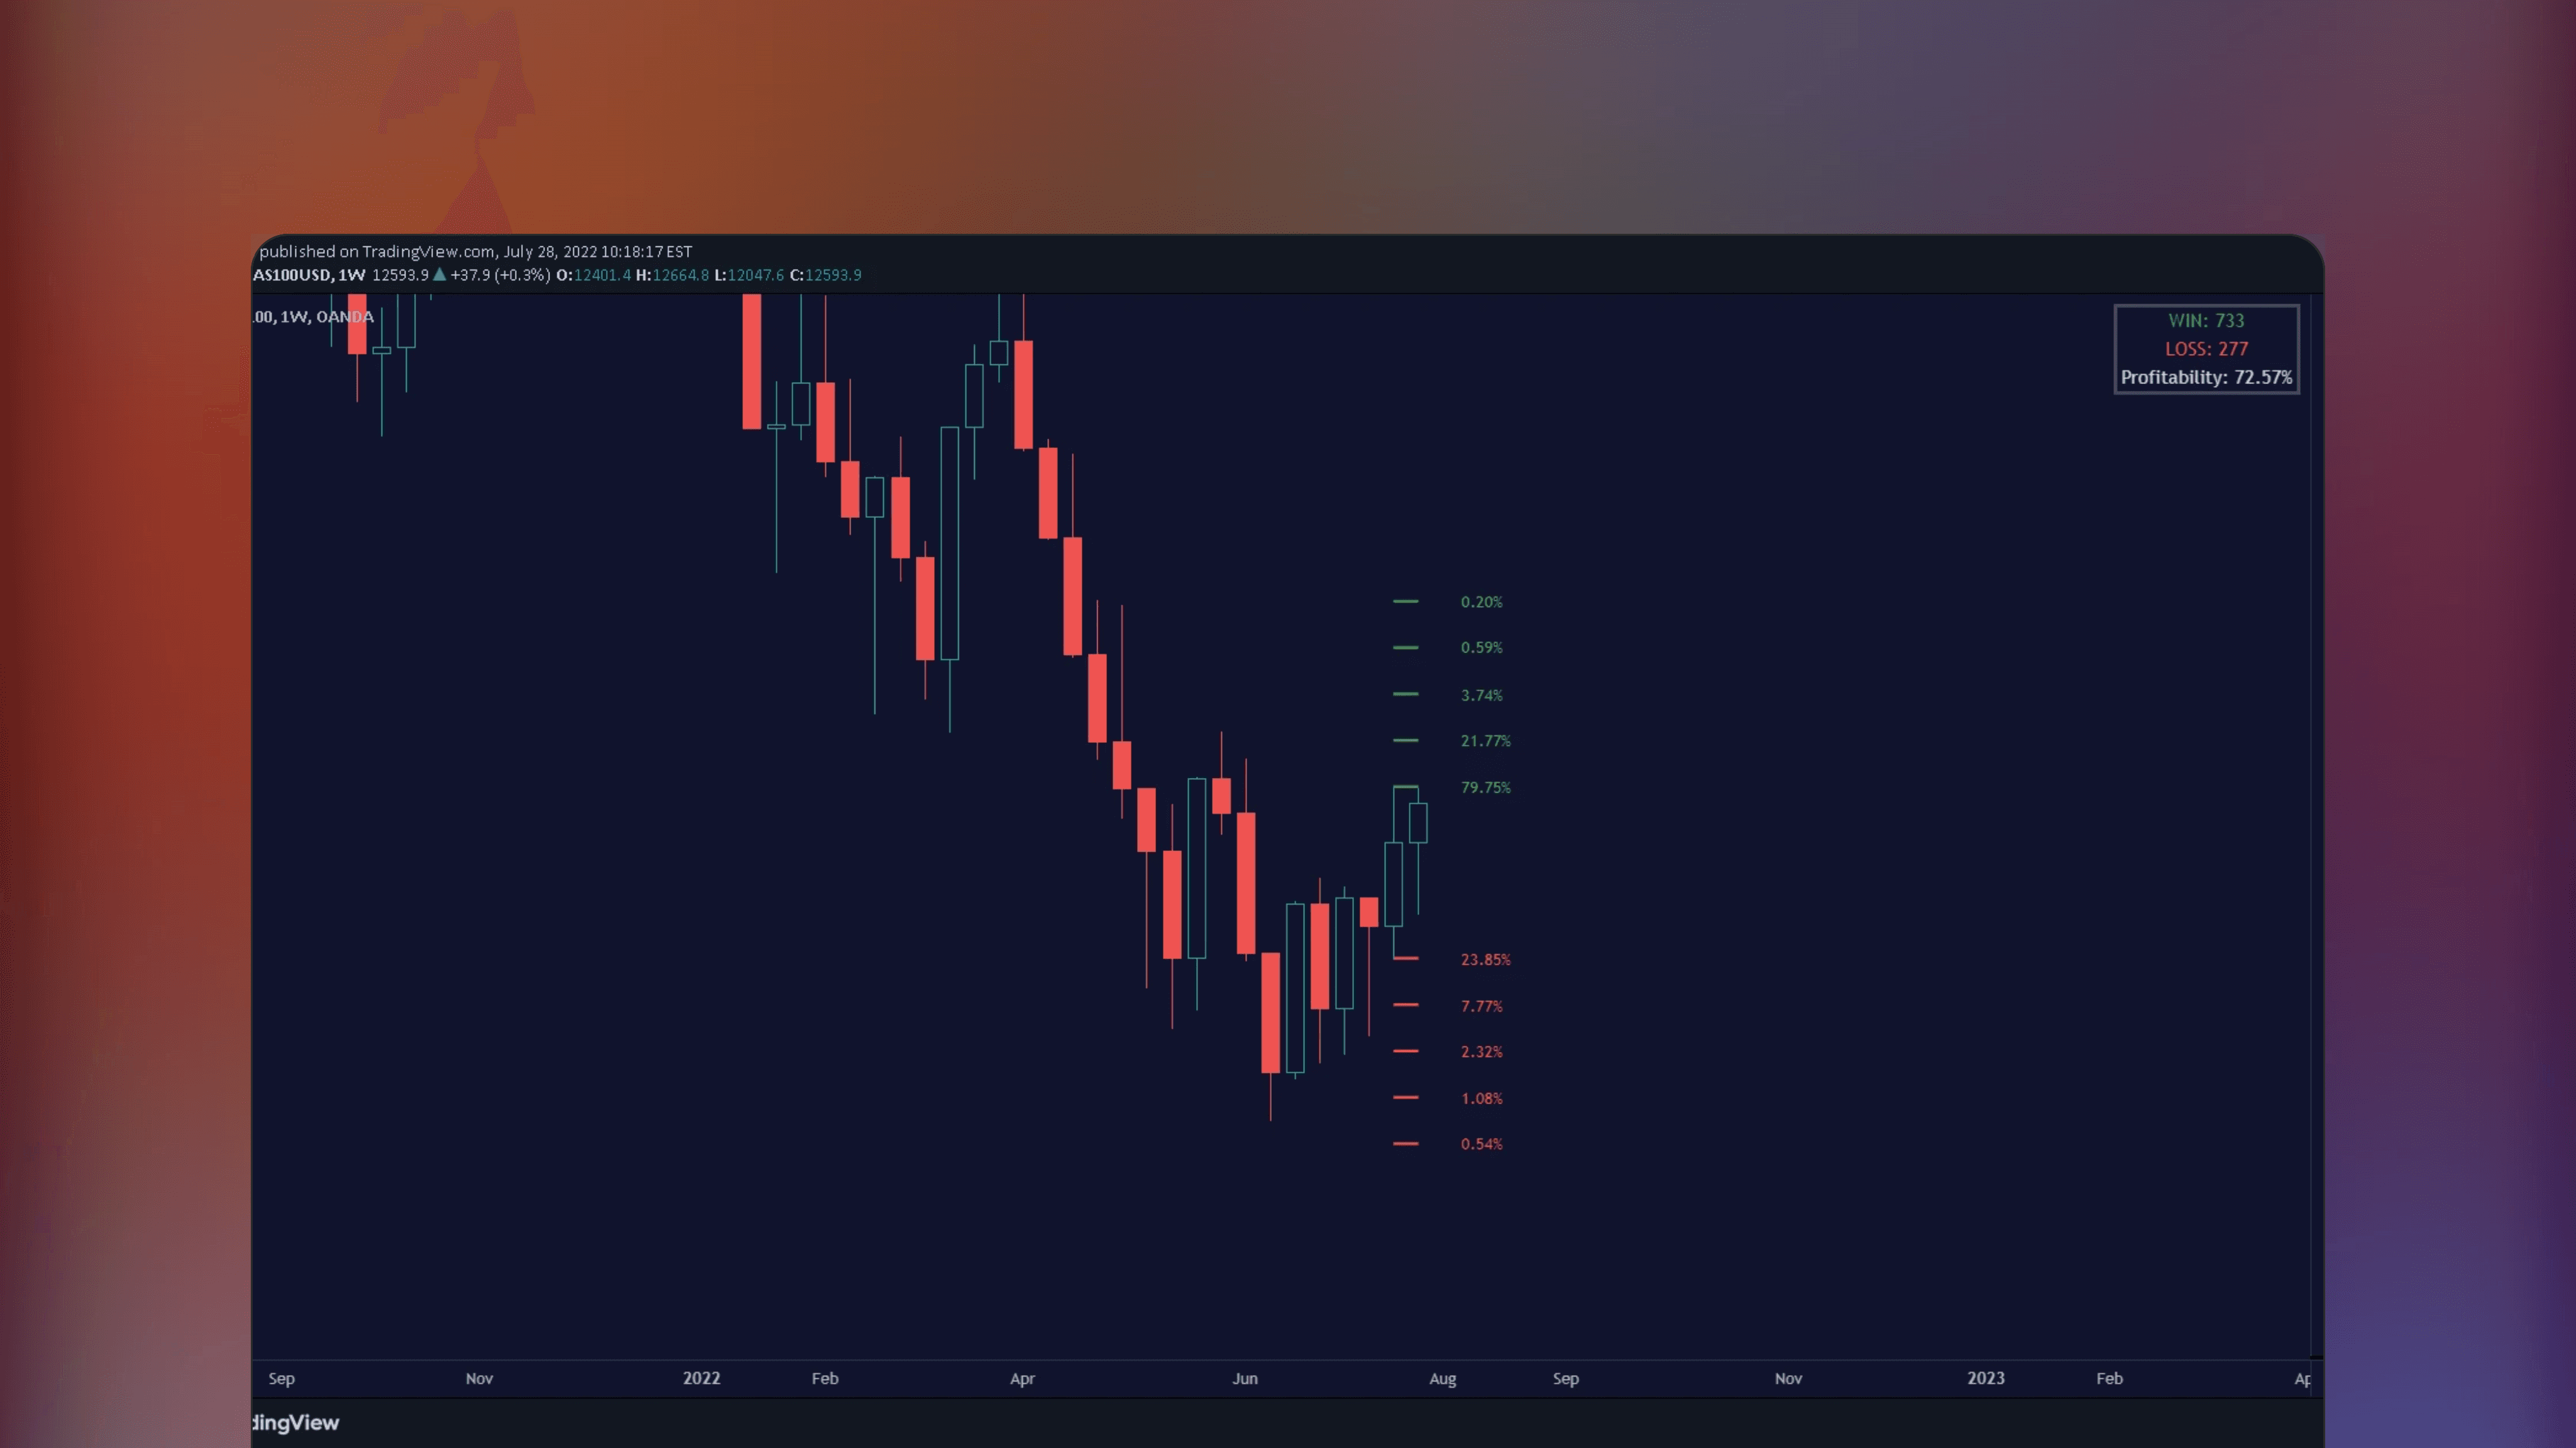
This TradingView Indicator analyzes the timing and frequency of daily market tops and bottoms to form statistical edge. Let's take a look at a few ways you can incorporate the Tops & Bottoms - Time of Day Report into your market analysis.
This TradingView Indicator analyzes the timing and frequency of daily market tops and bottoms to form statistical edge. Let's take a look at a few ways you can incorporate the Tops & Bottoms - Time of Day Report into your market analysis.
1
1
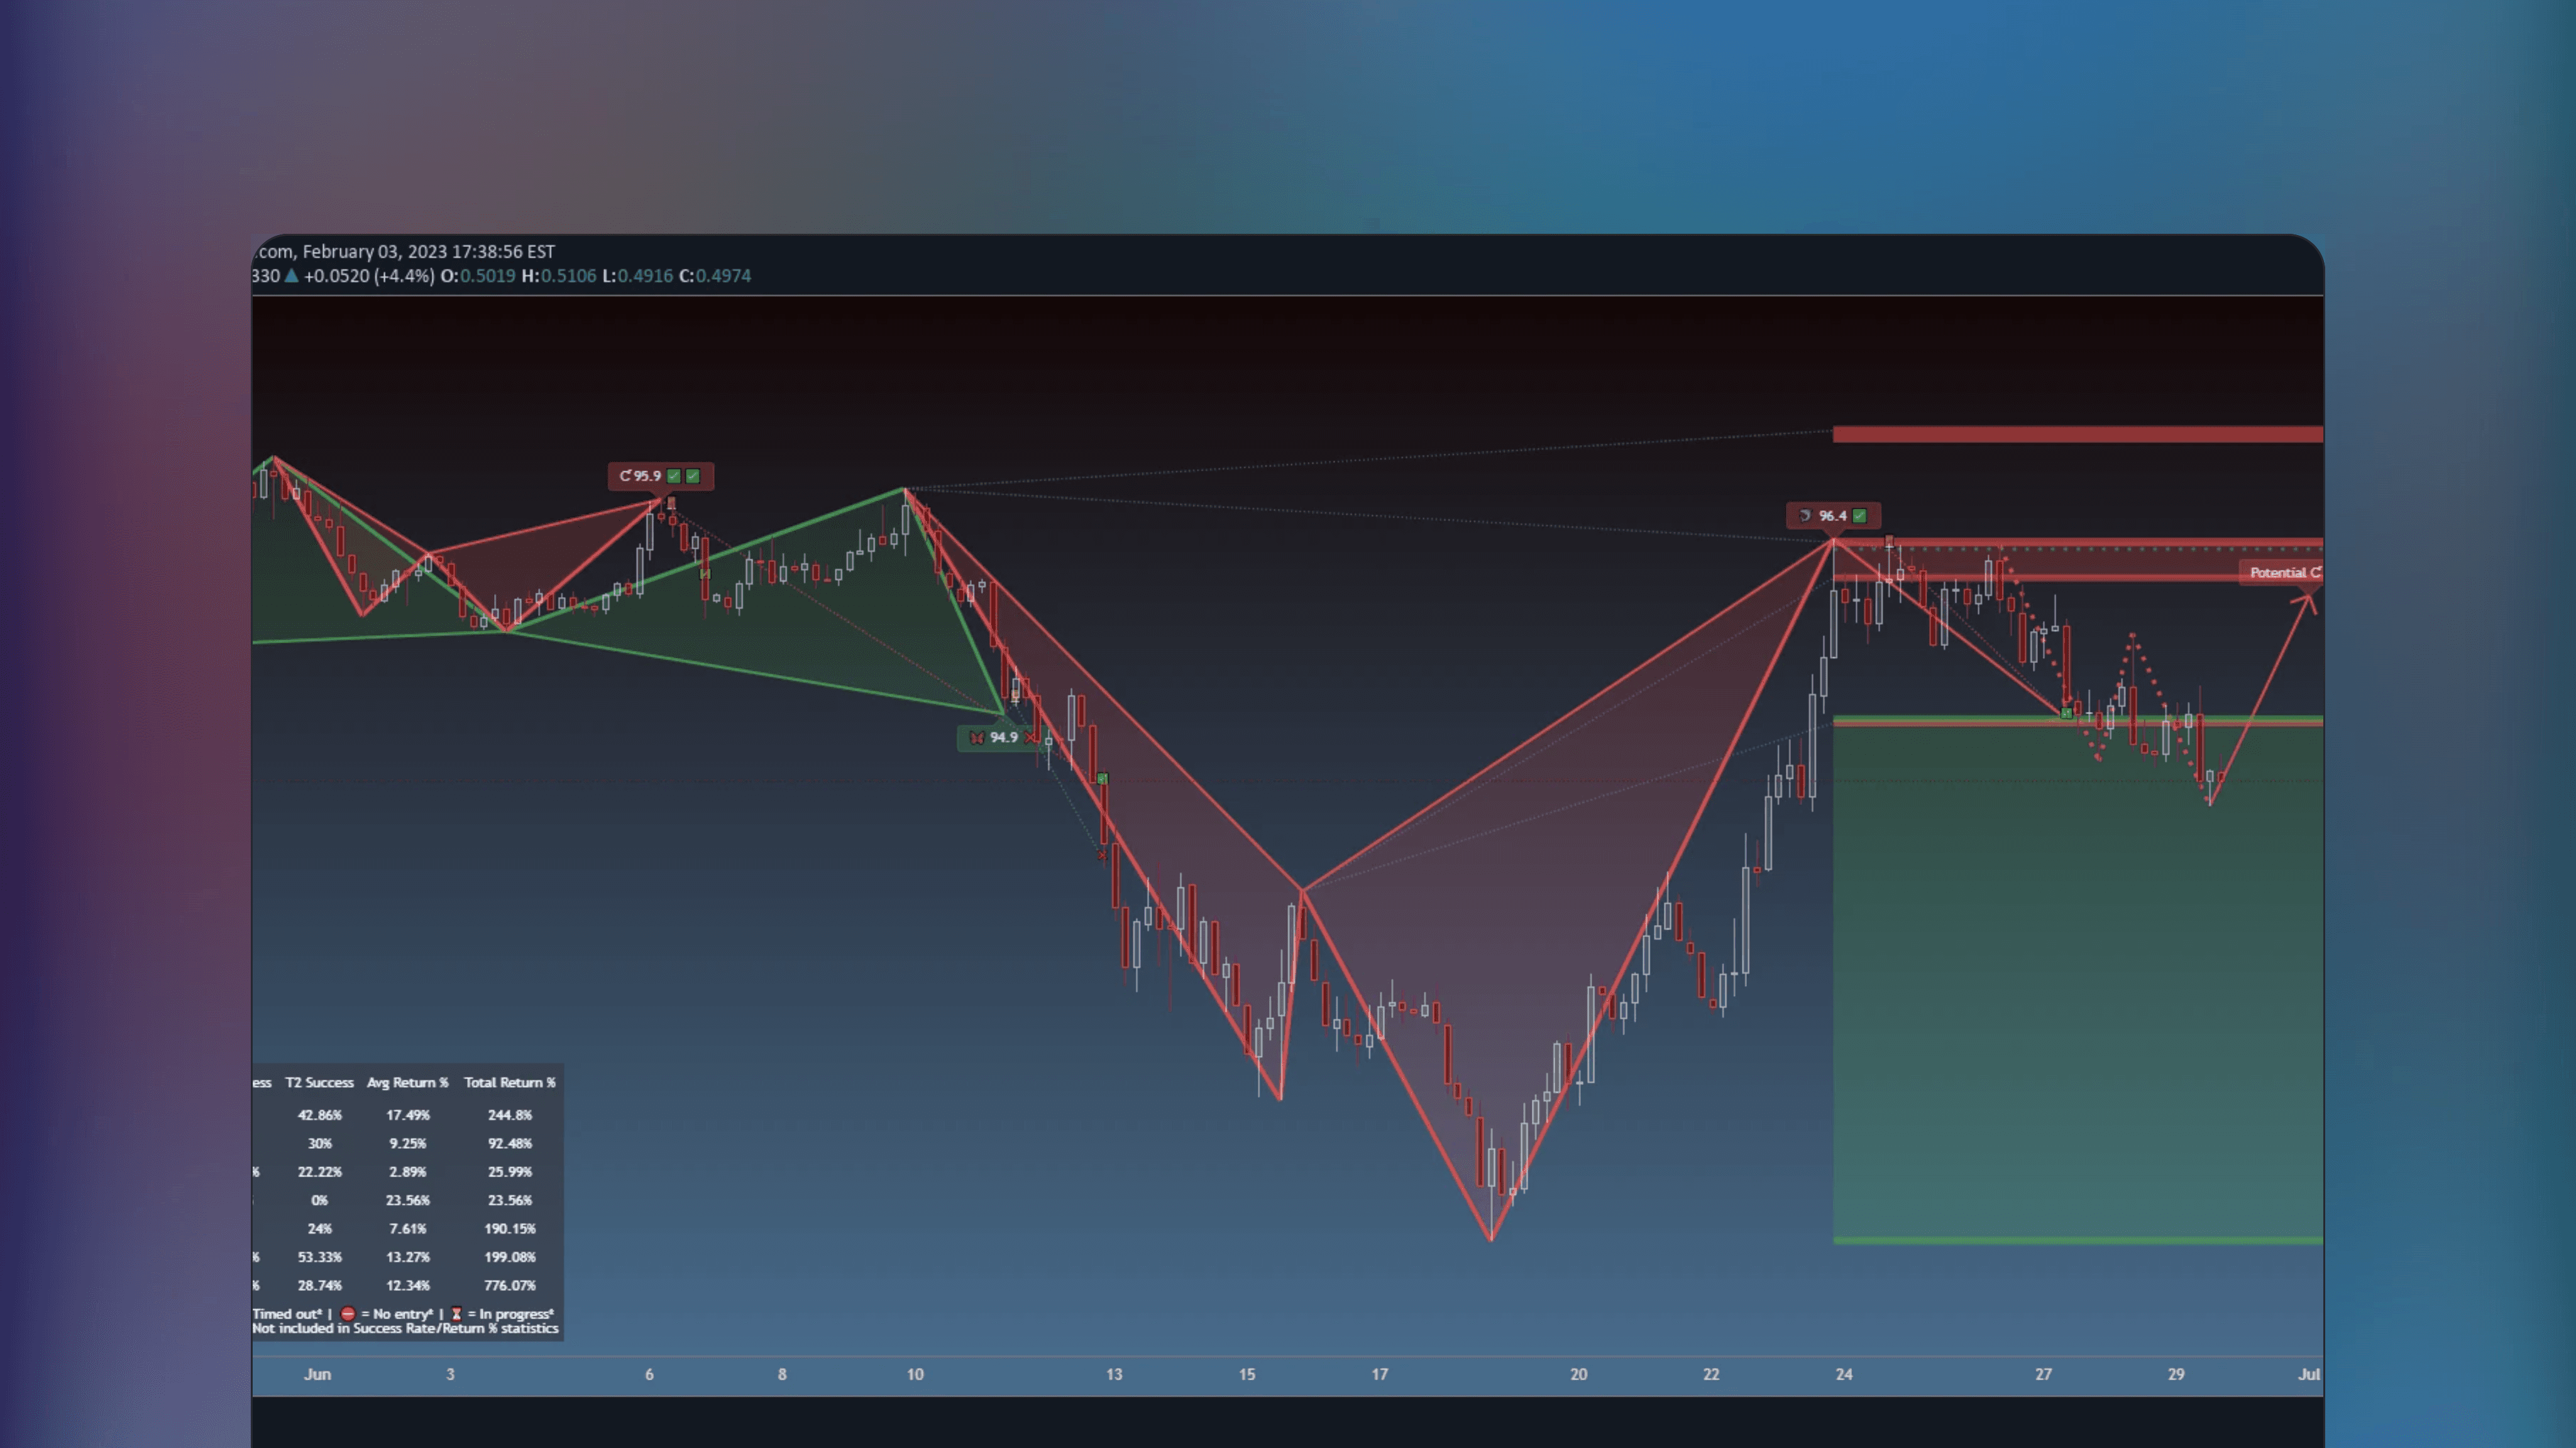
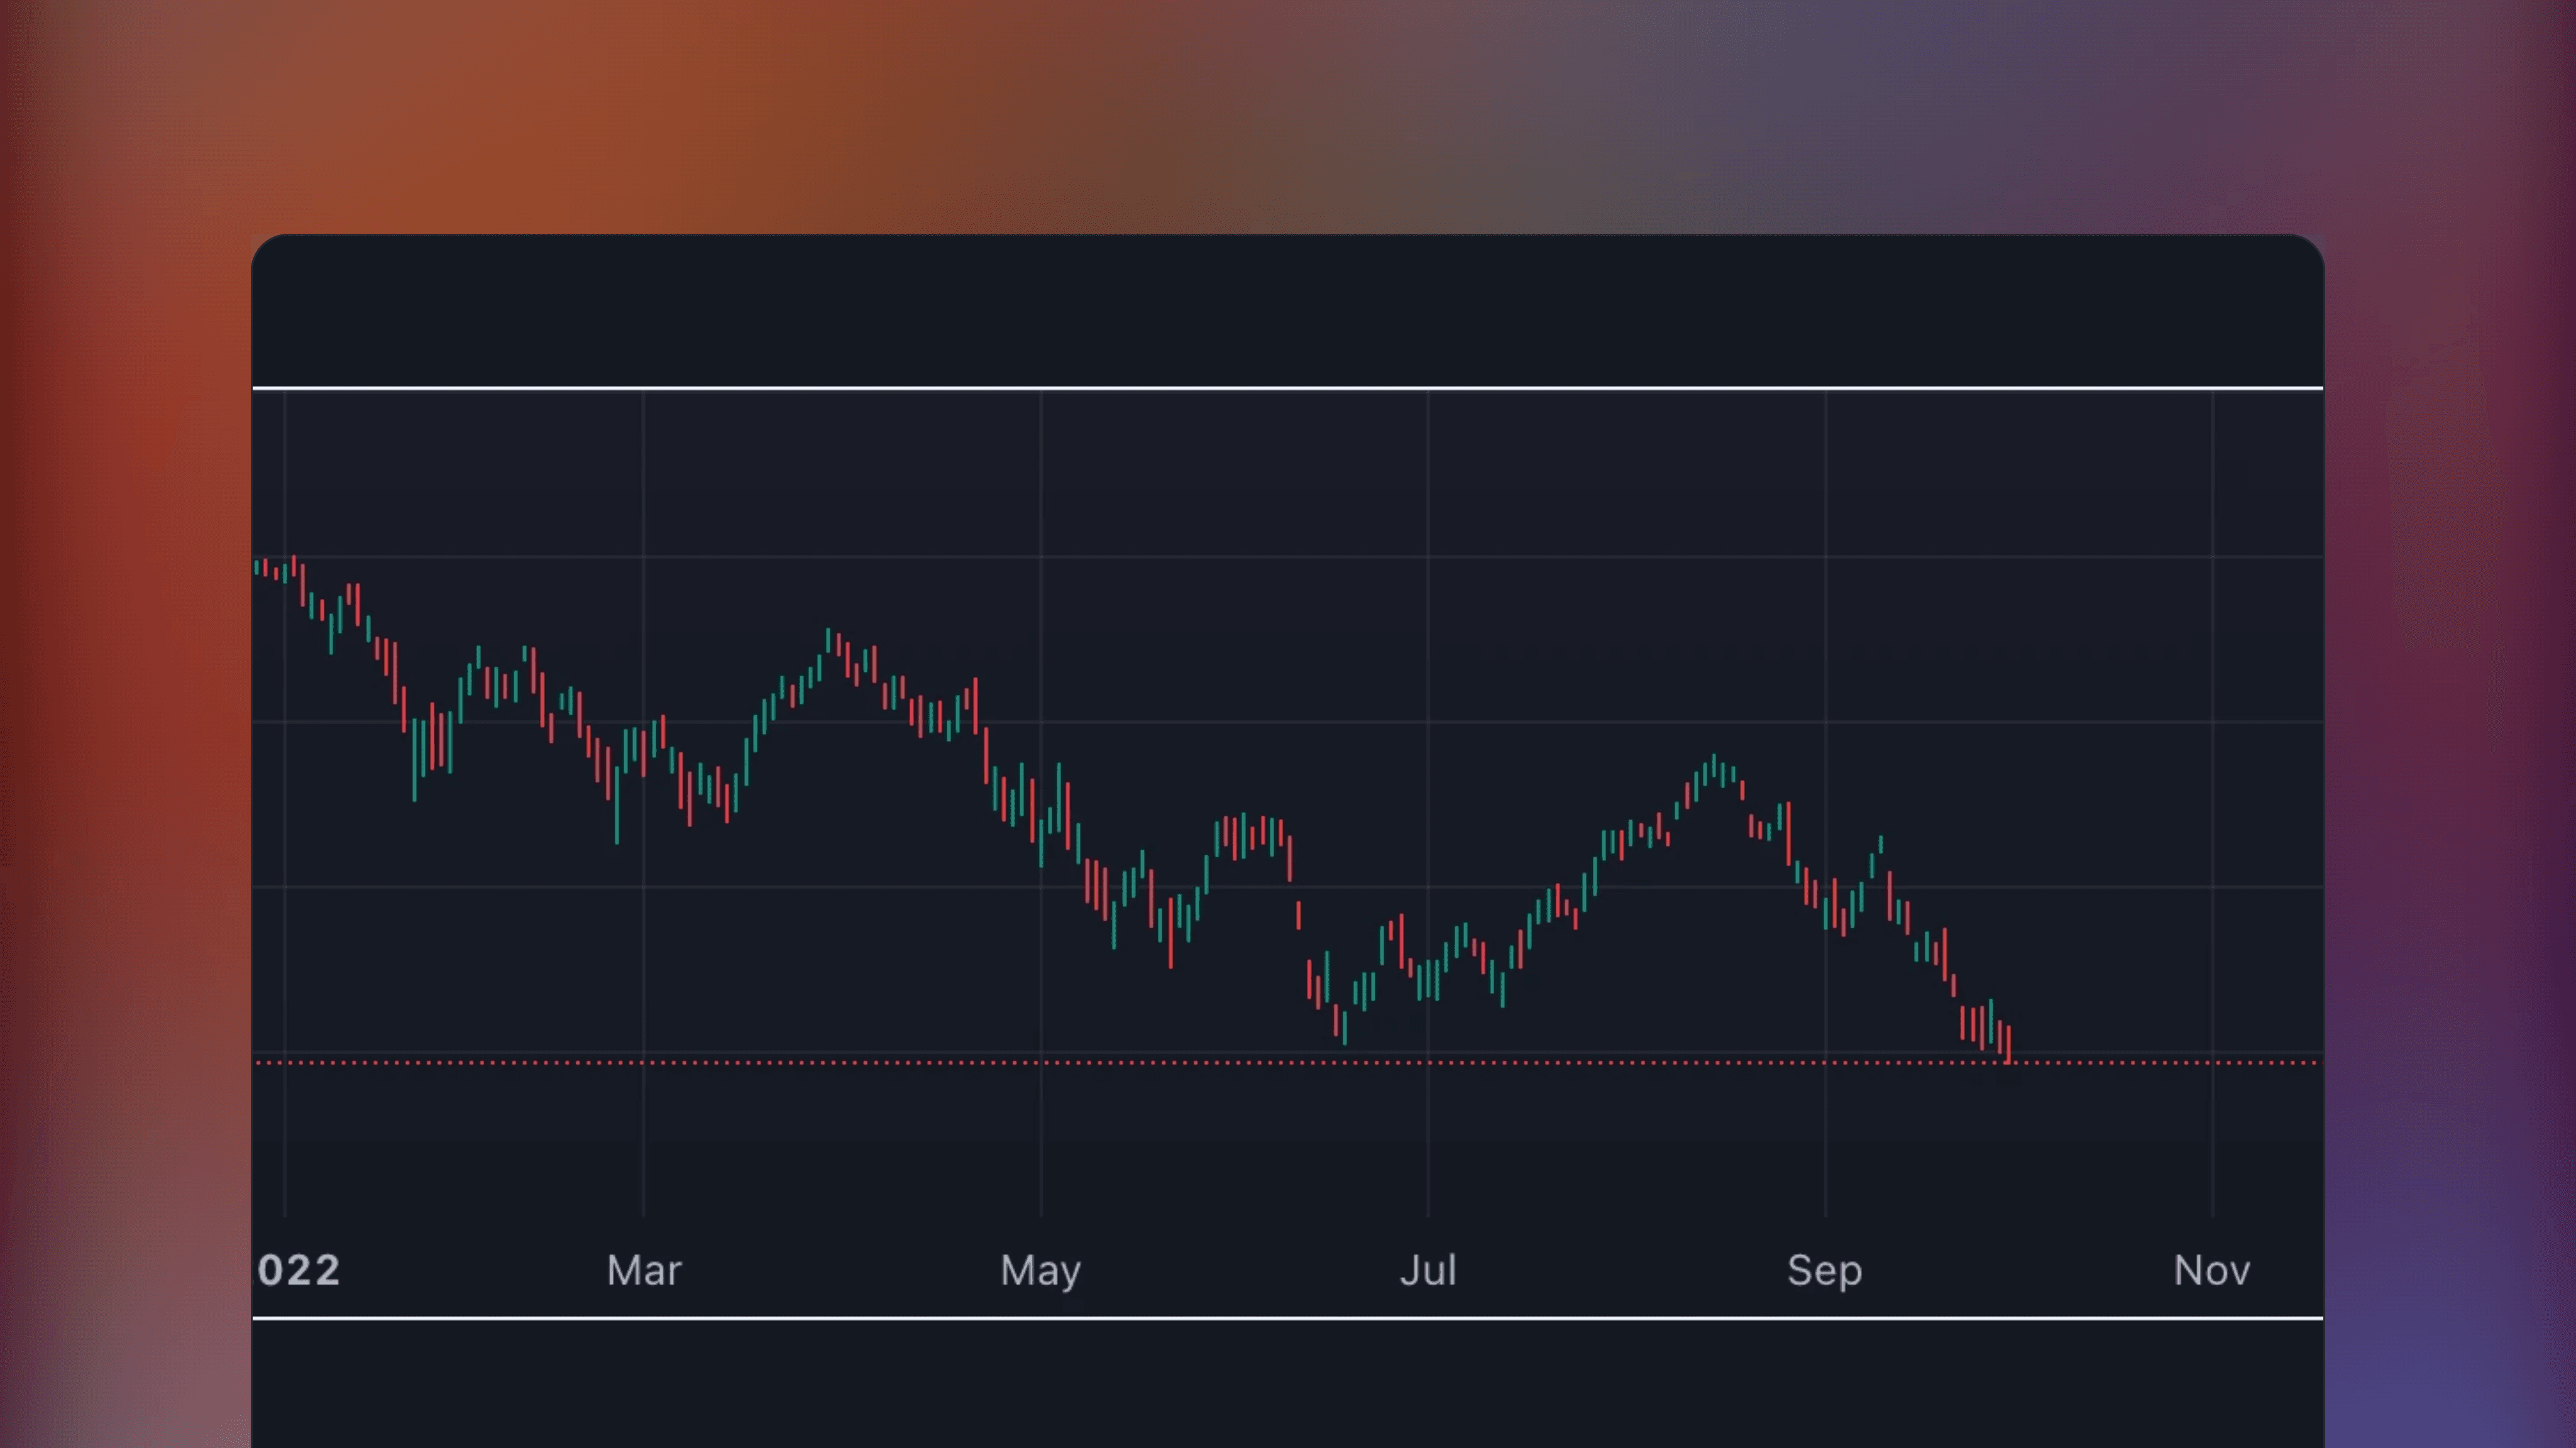
Study time based market dynamics
Study time based market dynamics
2
2
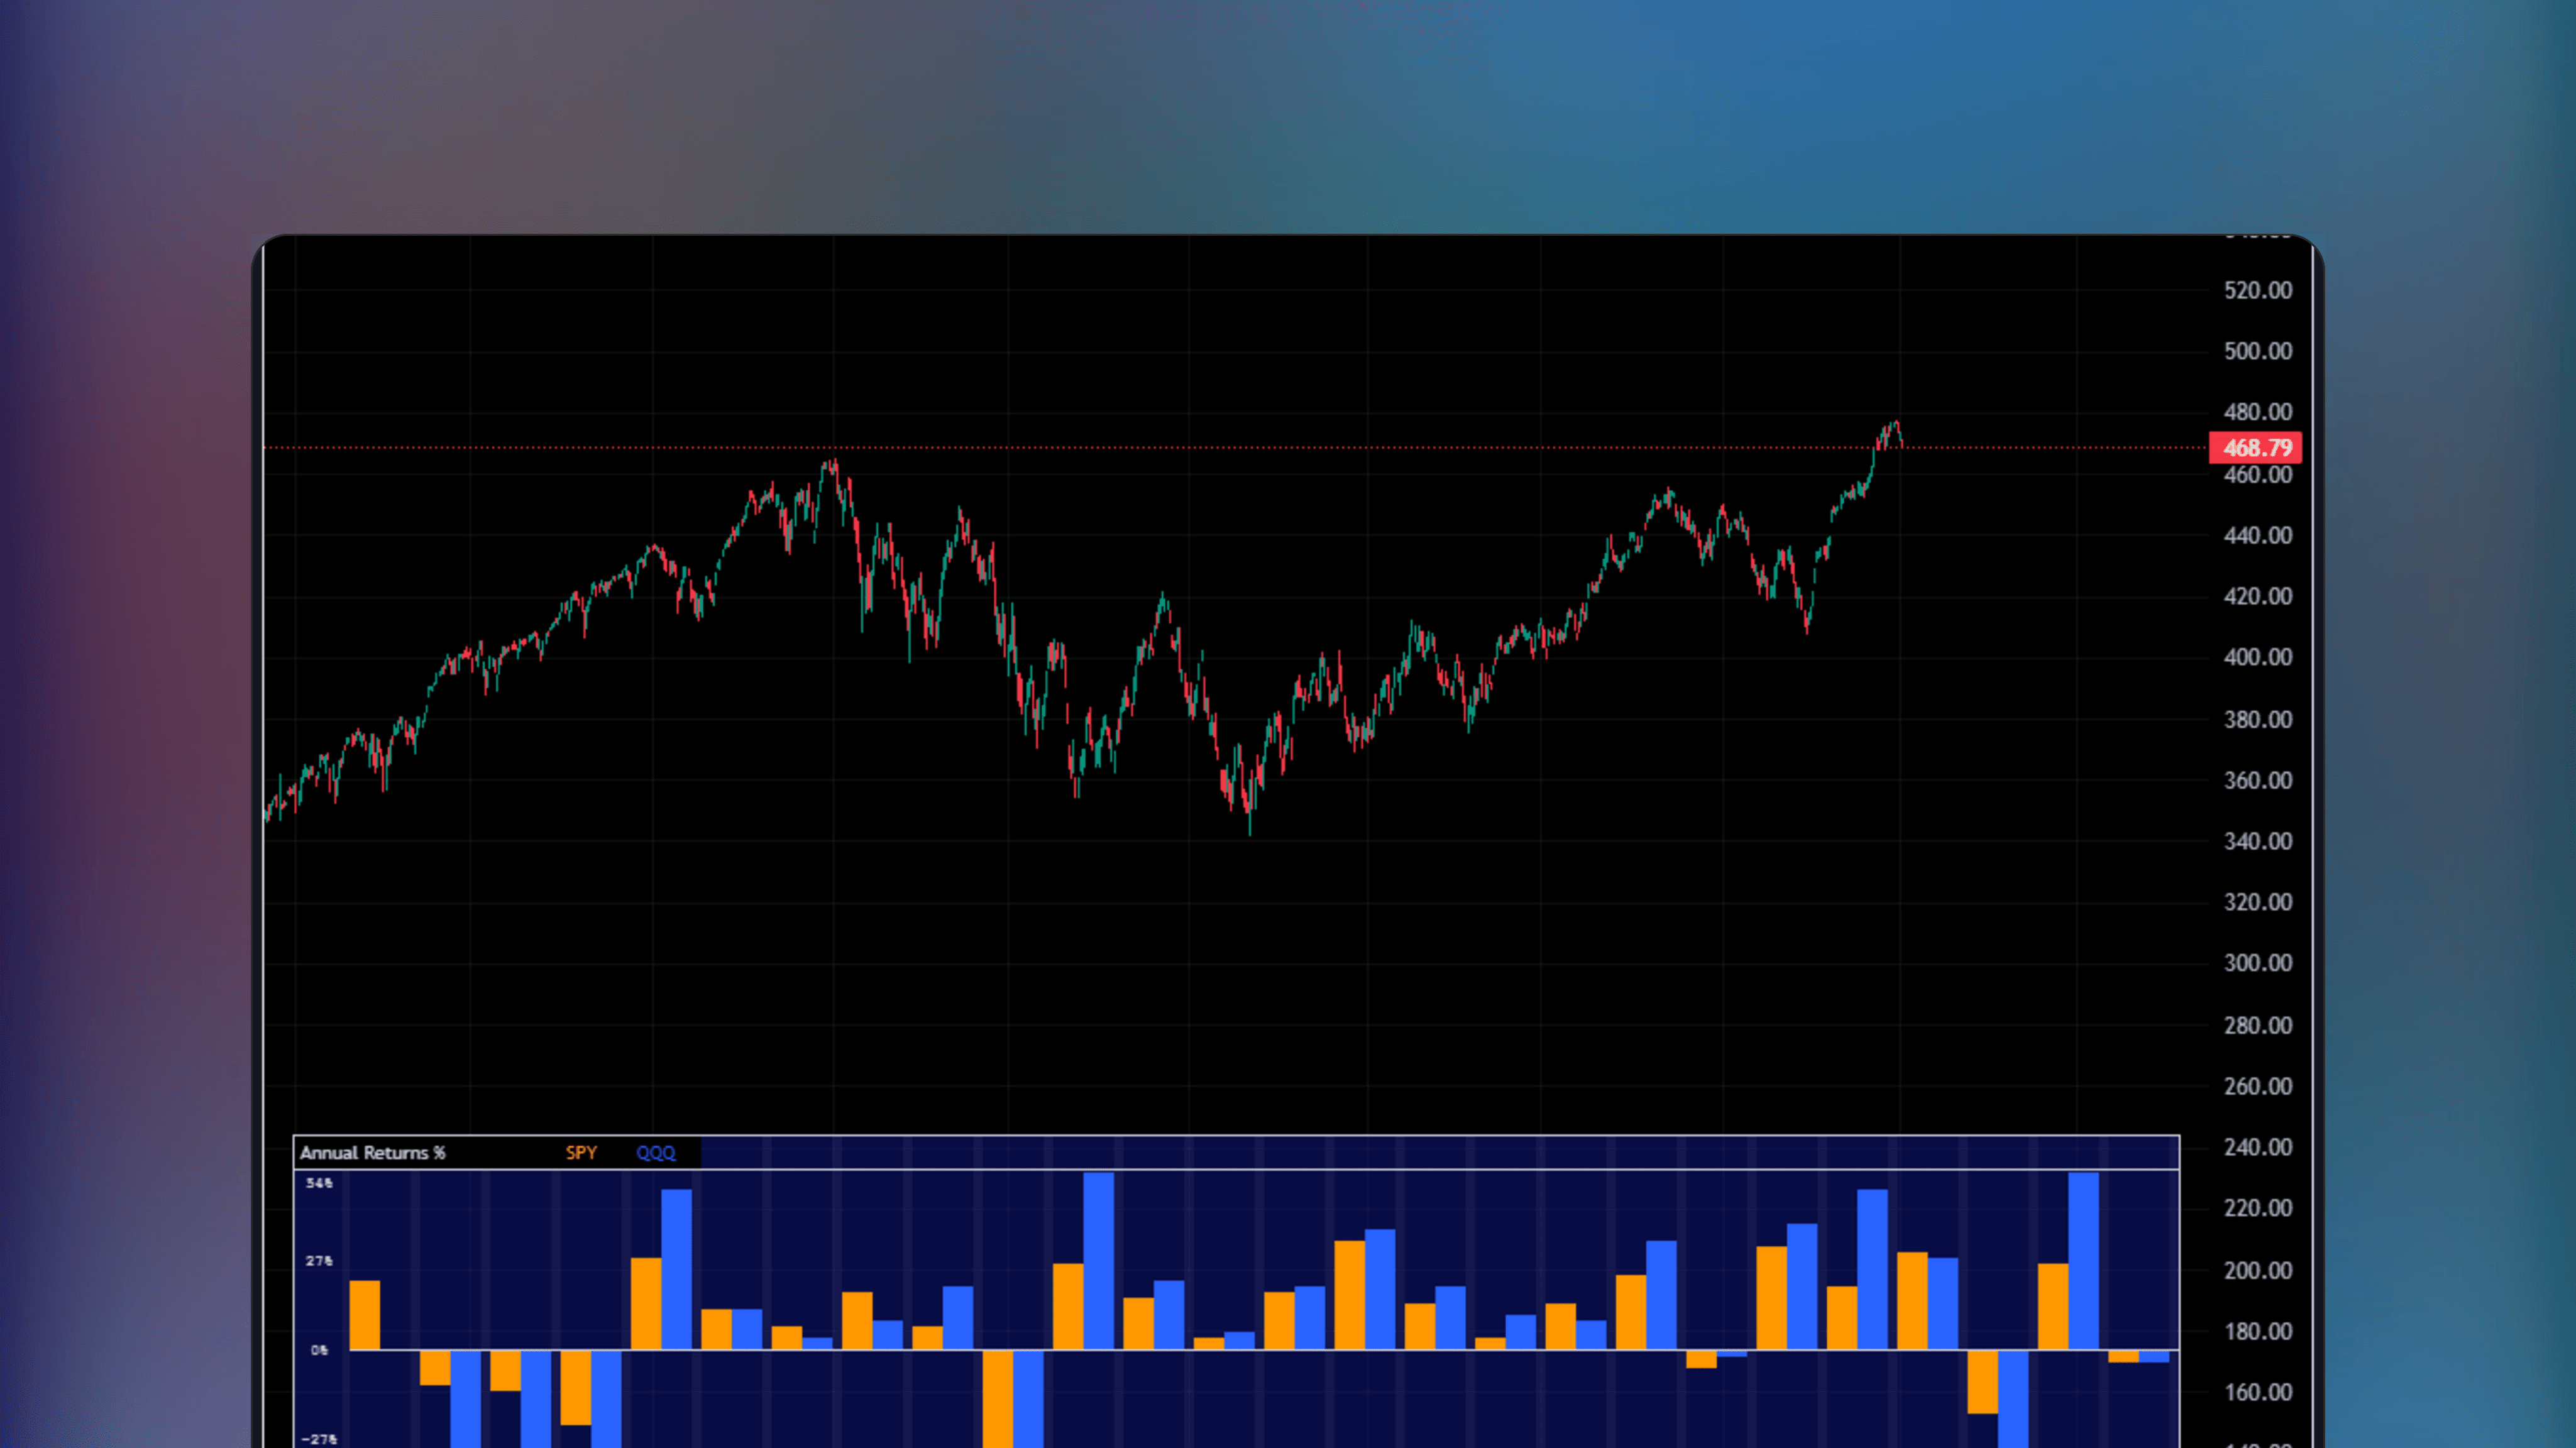
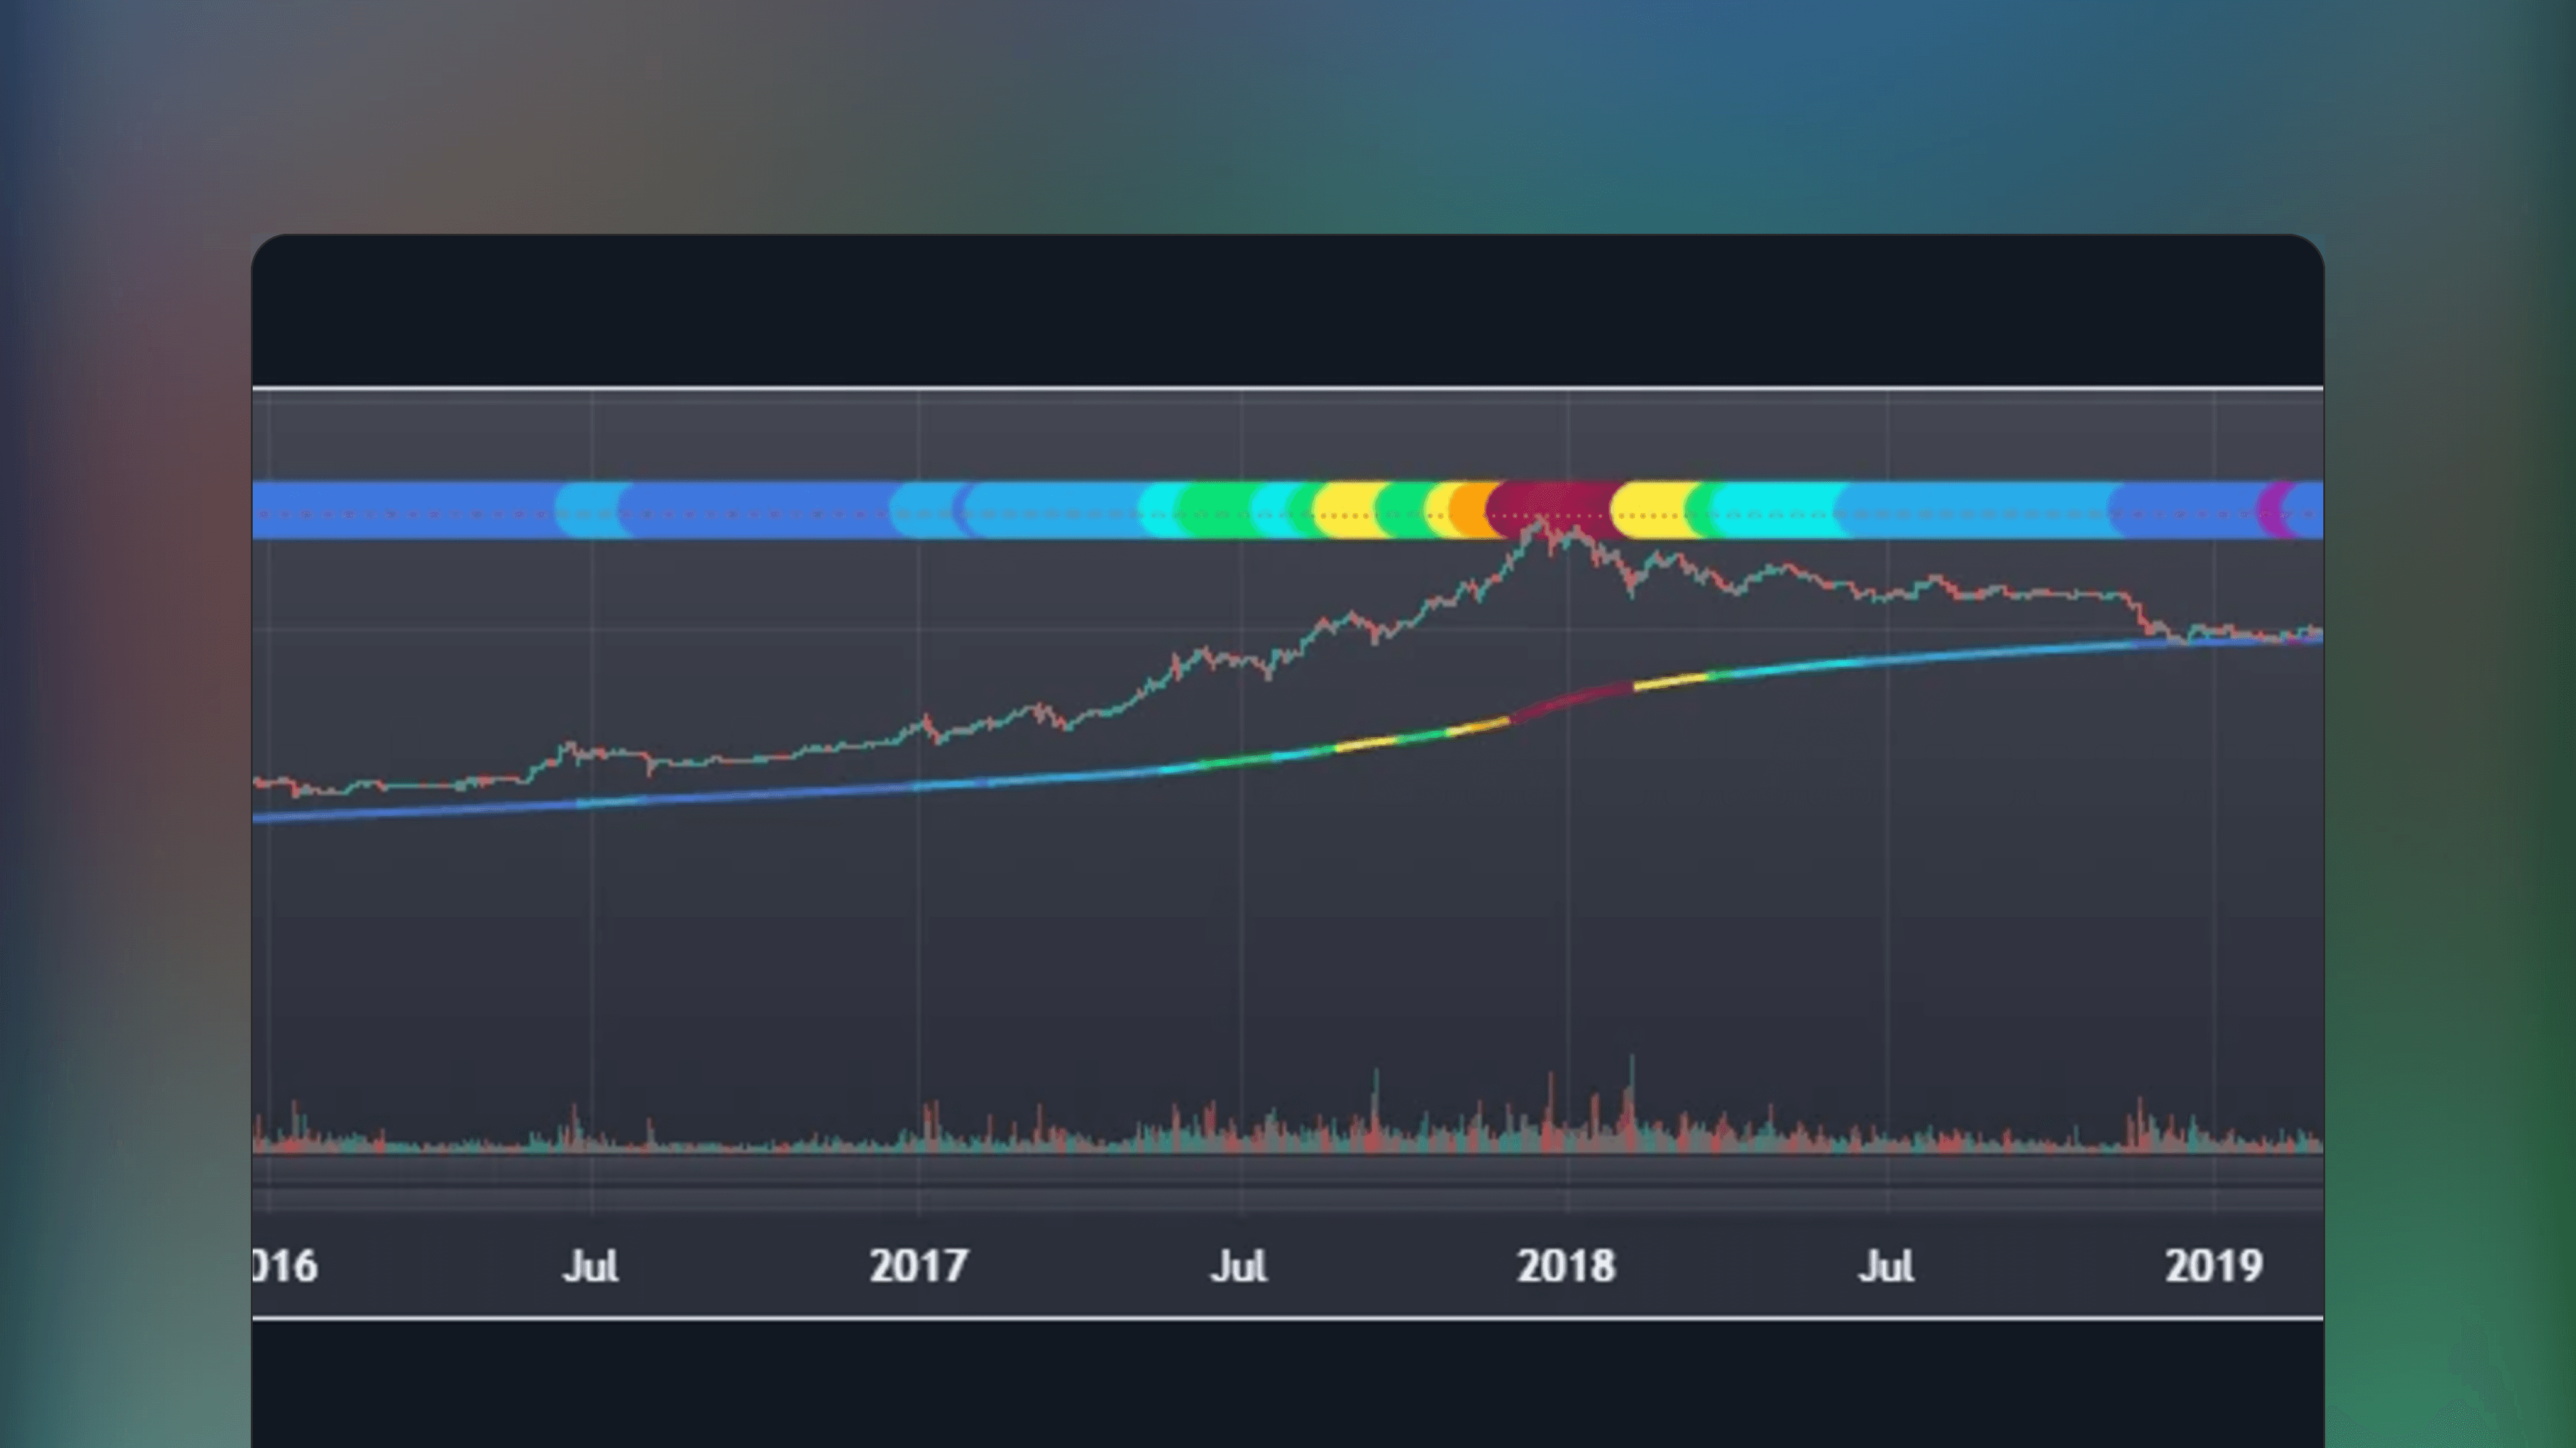
Get confluence from statistical edge
Get confluence from statistical edge
3
3
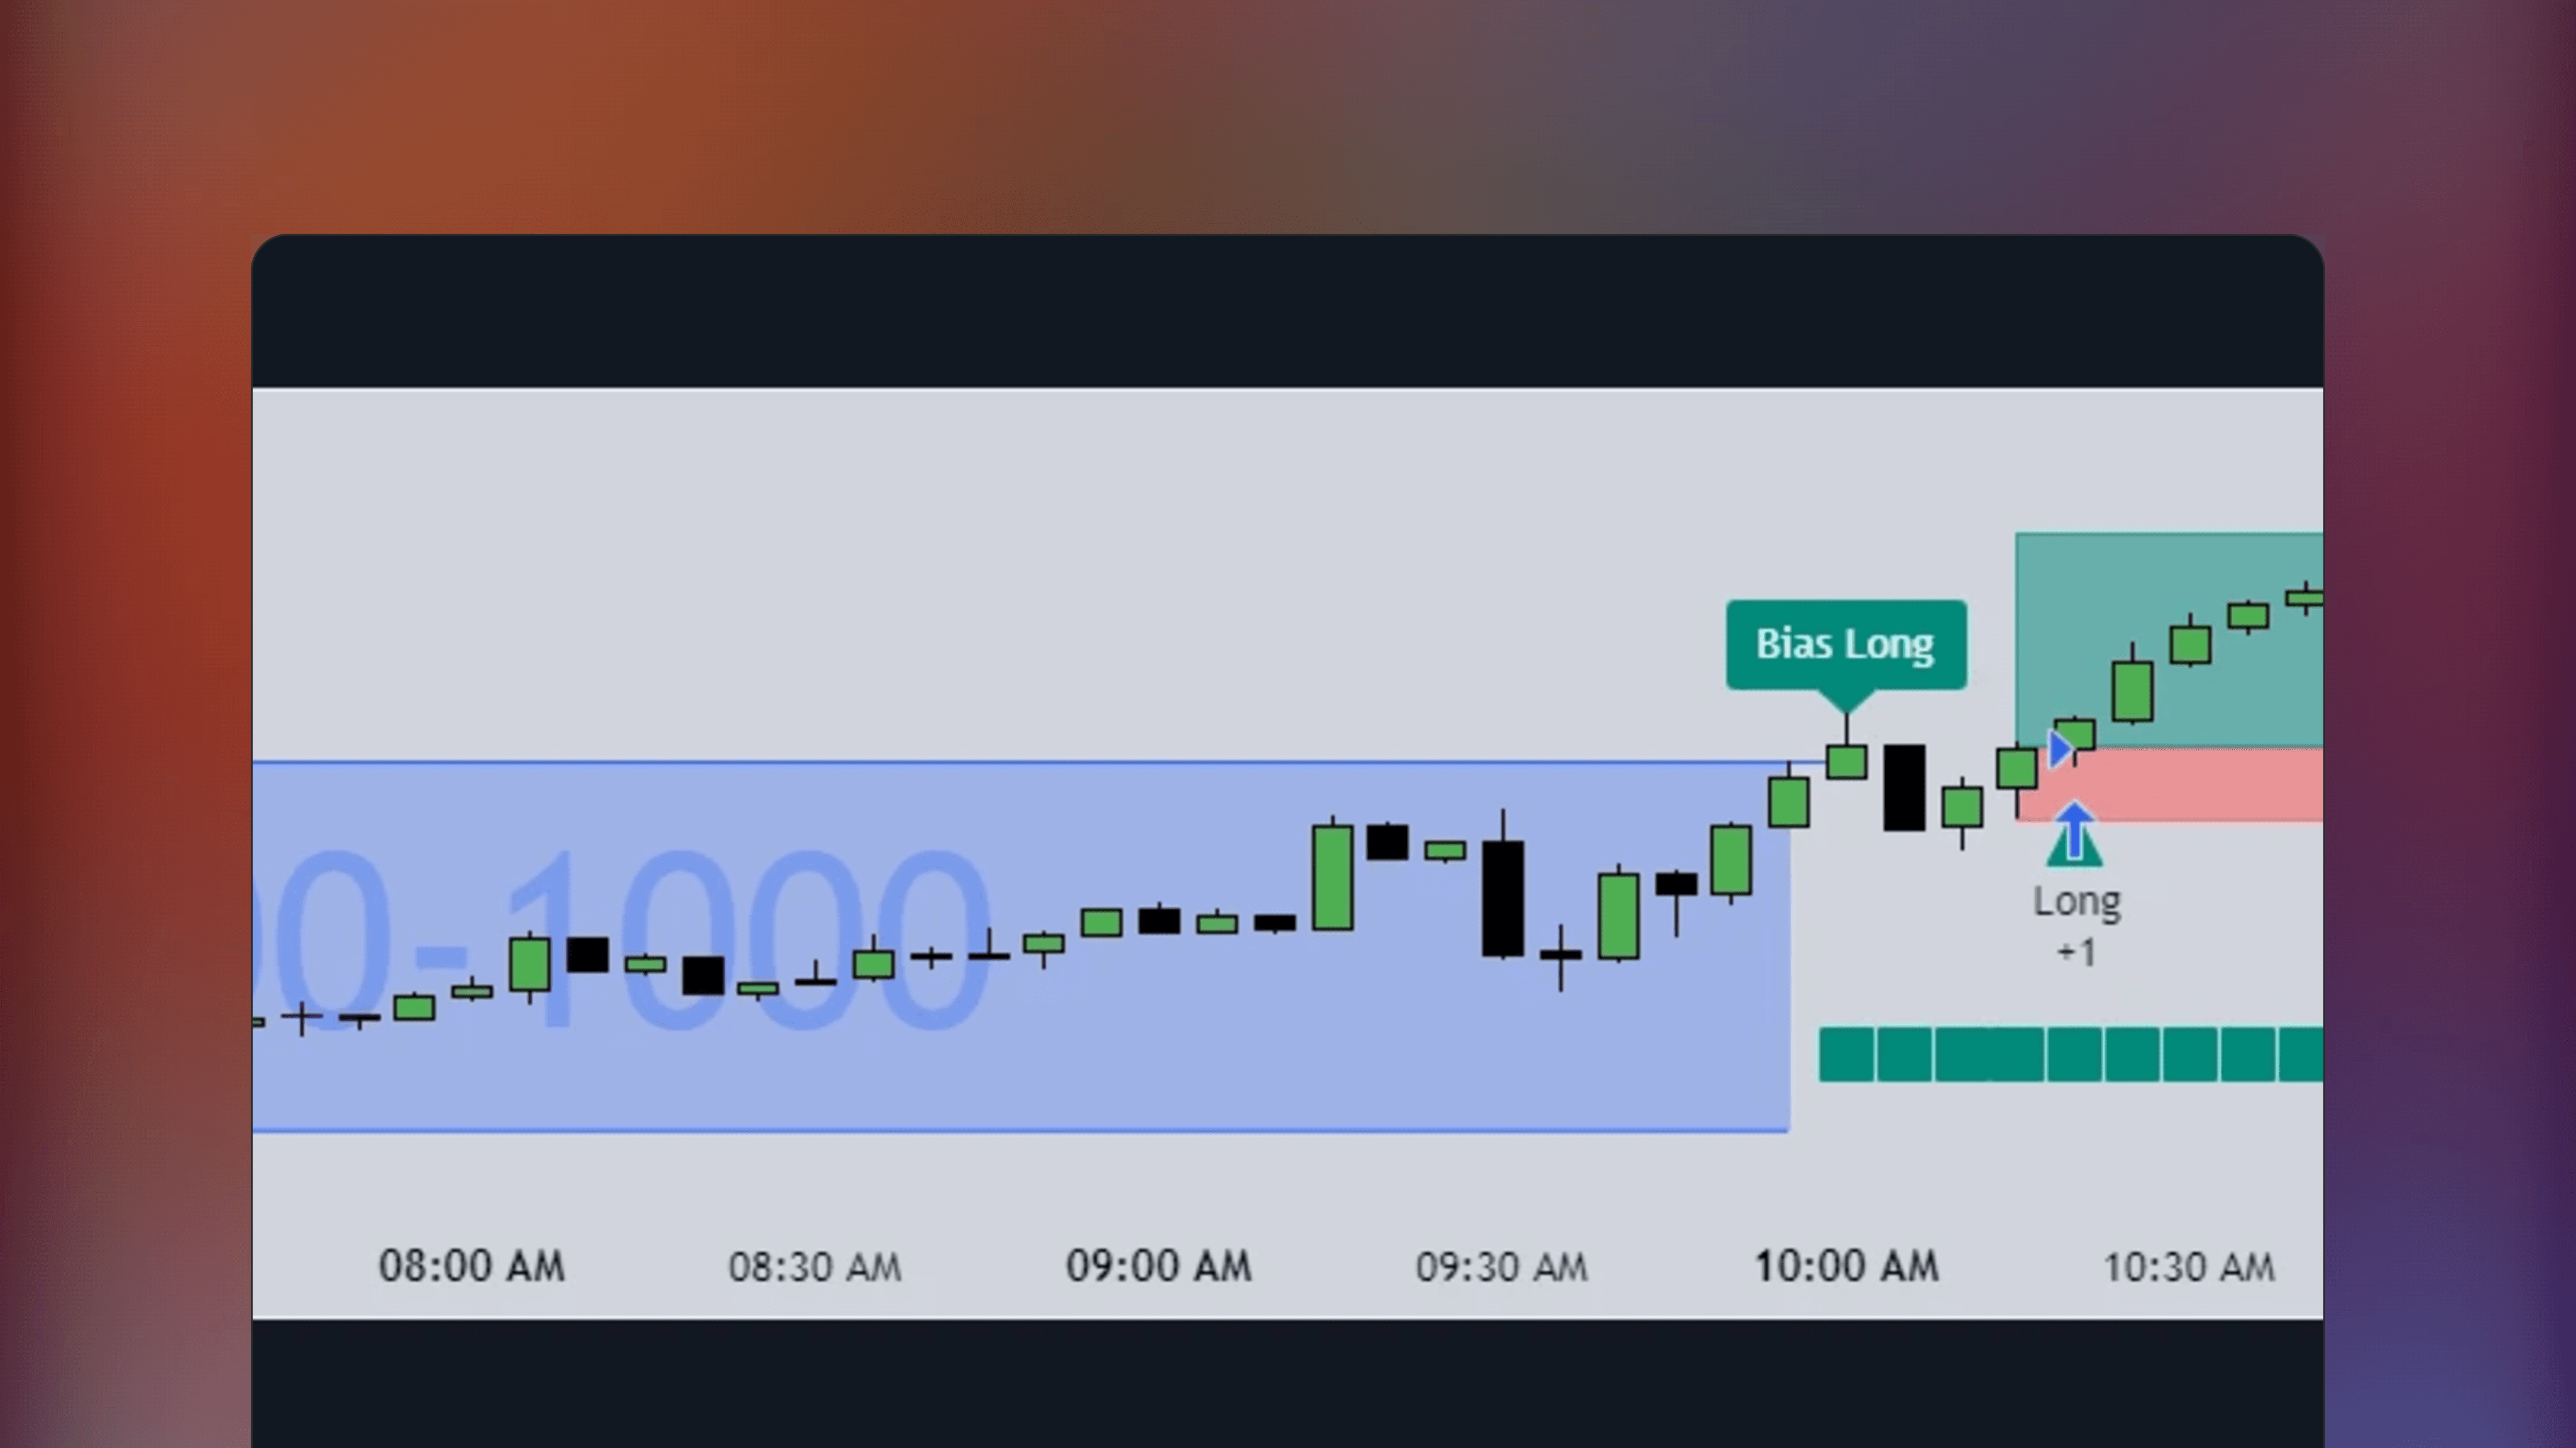
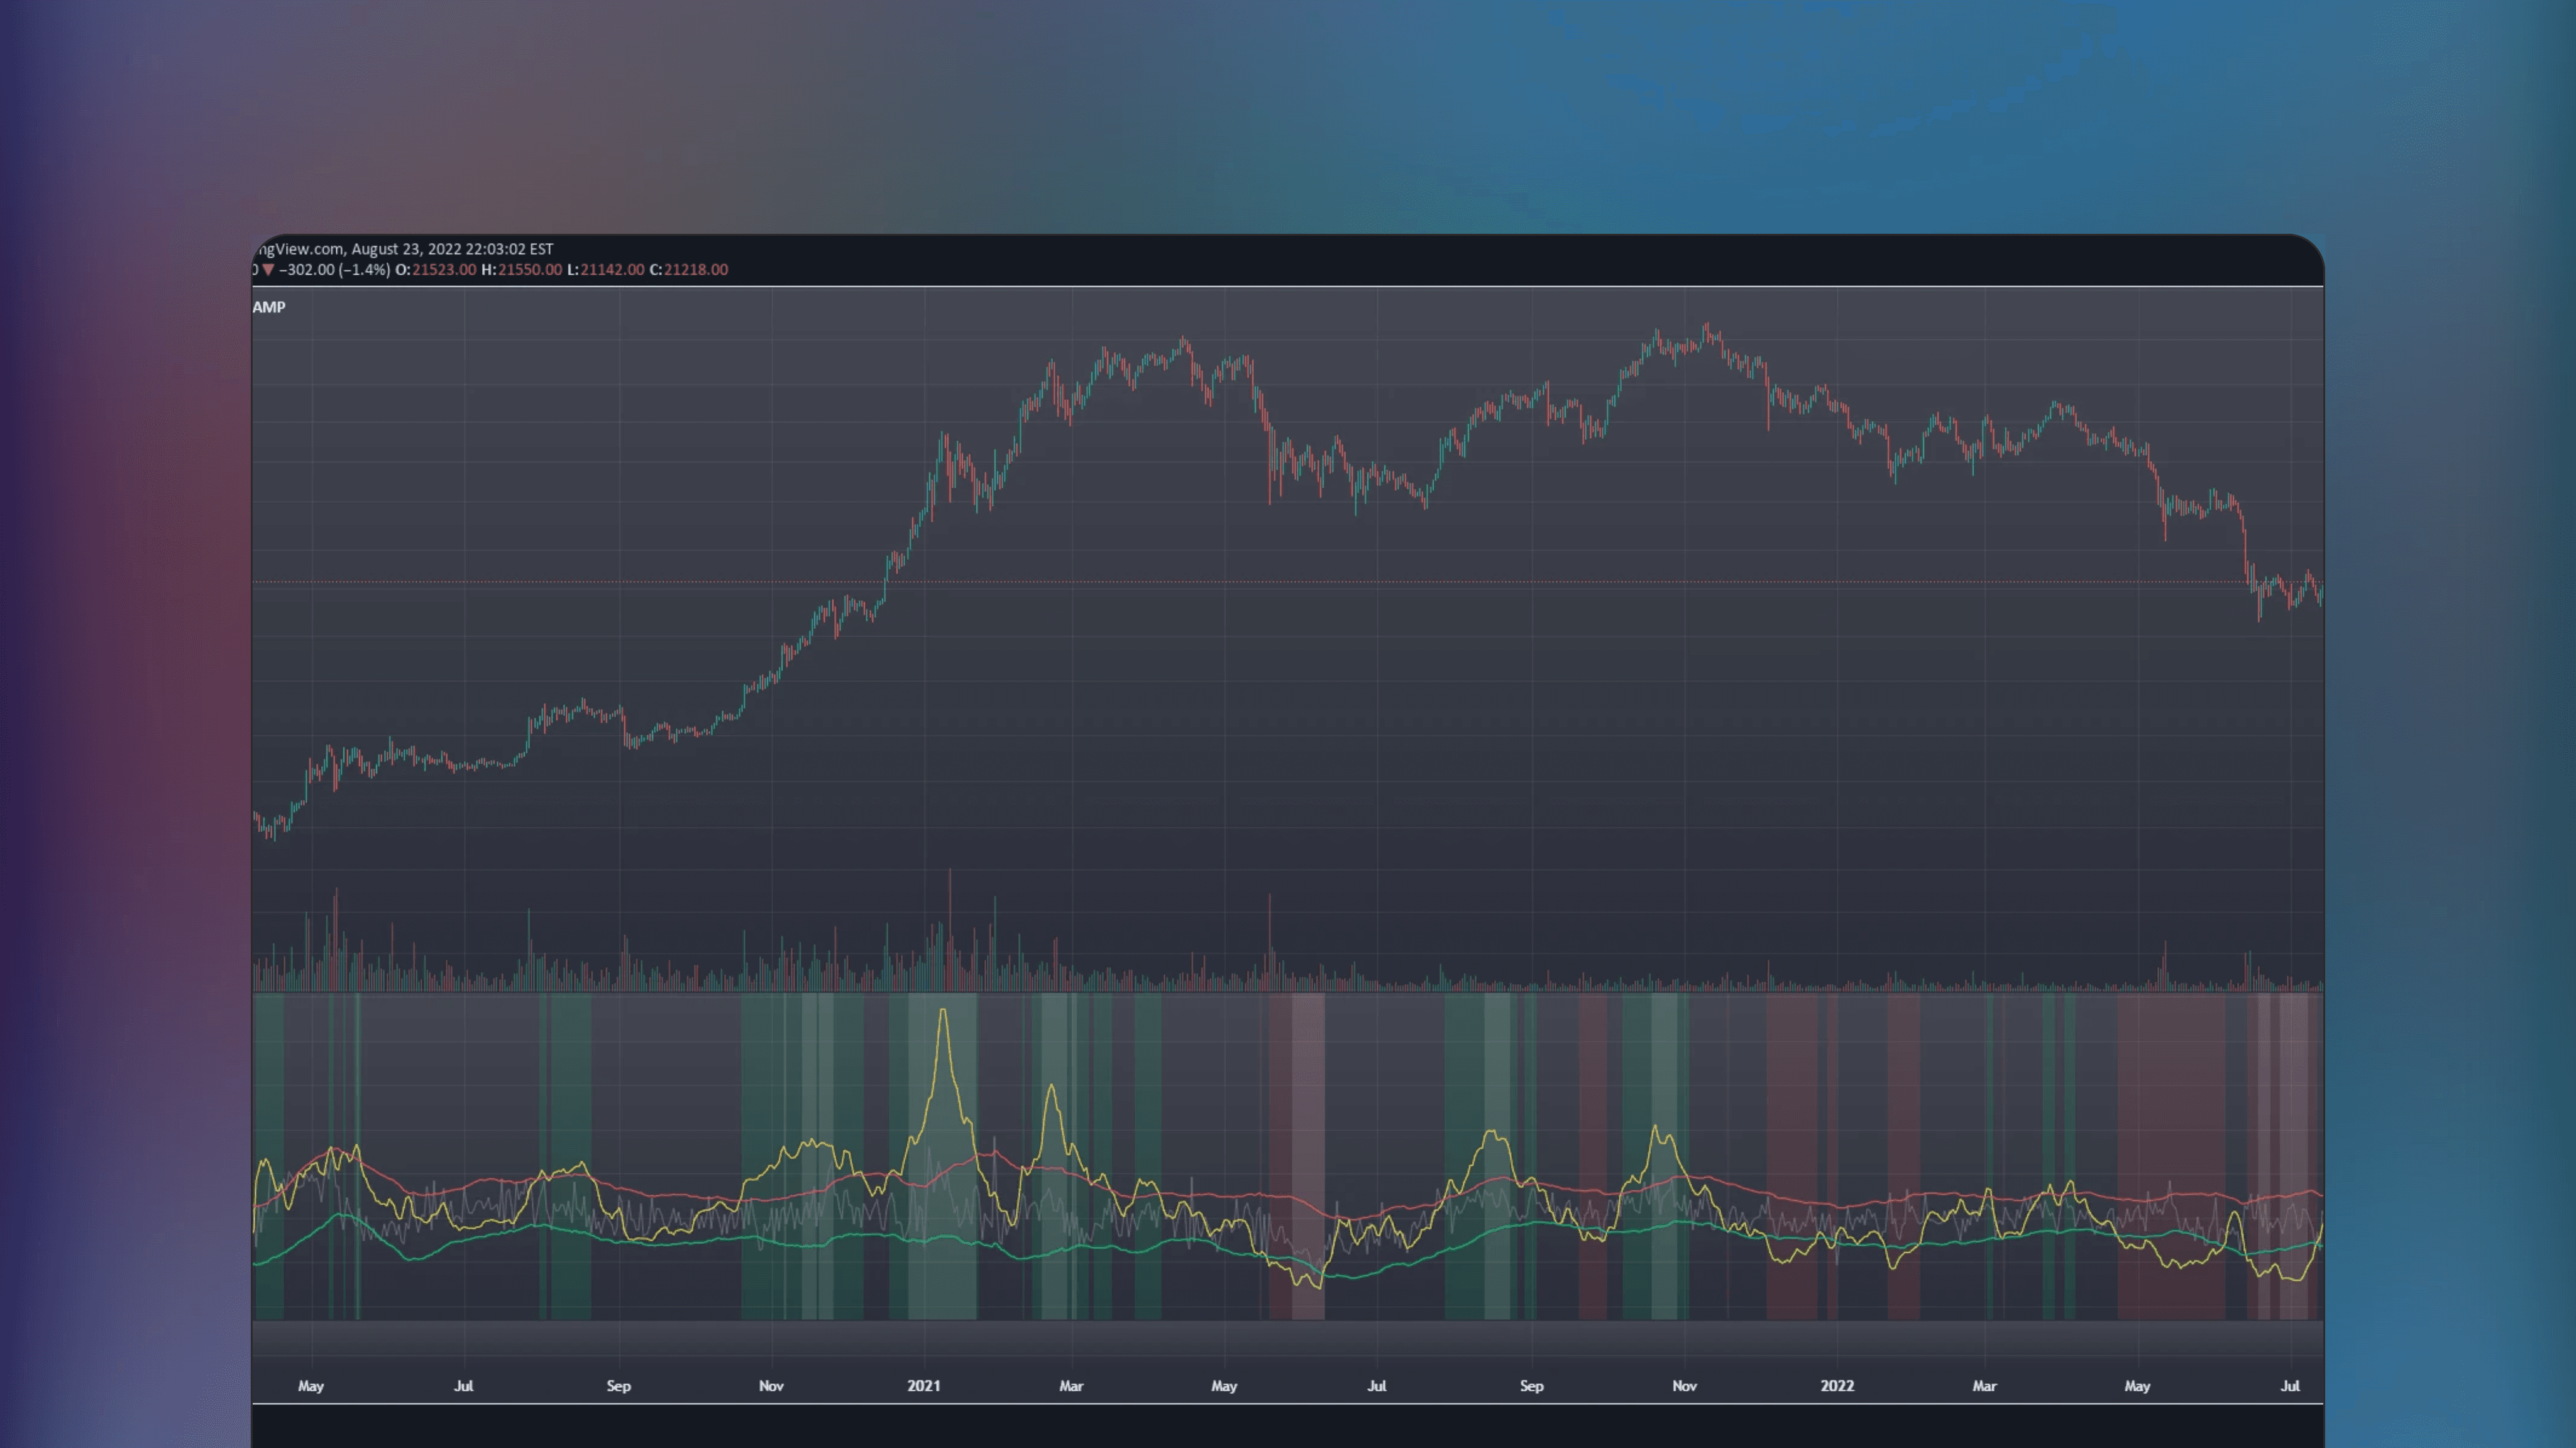
Use for determining trading bias
Use for determining trading bias
😃
😃
Traders are happy with this
Traders are happy with this
The general mood on the web toward the Tops & Bottoms - Time of Day Report is positive, indicating traders find it useful and valuable for enhancing their trading activities.
The general mood on the web toward the Tops & Bottoms - Time of Day Report is positive, indicating traders find it useful and valuable for enhancing their trading activities.
Source: Online Discussion
Source: Online Discussion
Source: Online Discussion


Bookmark
Saved here
🤖
Get Indicator
Find Indicator
3
Comments
Read on Telegram
Listing by third party publisher. Not financial advice.
Risk Disclosure


Share Listing
🤖
🤖
Get Indicator
Get Indicator
Find Indicator
Find Indicator
Saved here
Bookmark
Listing by third party publisher. Not financial advice.
Listing by third party publisher. Not financial advice.
Risk Disclosure
Risk Disclosure
Share
🤖
3


🤖
3
🤖
3
✍️
By Author
More by sbtnc
🔥
New Listings
Featured this week

🤖
by benten


Free
ThinkOrSwim Indicator
Triple VWAP Indicator For ThinkOrSwim
New
🔑
✅
Triple VWAP Indicator for ThinkorSwim VWAP by adding 1 to 3 standard deviation bands alongside VWAP, providing a more detailed view of extreme deviations based on market volatility.
🤖
by scriptor


Free
MetaTrader Indicator
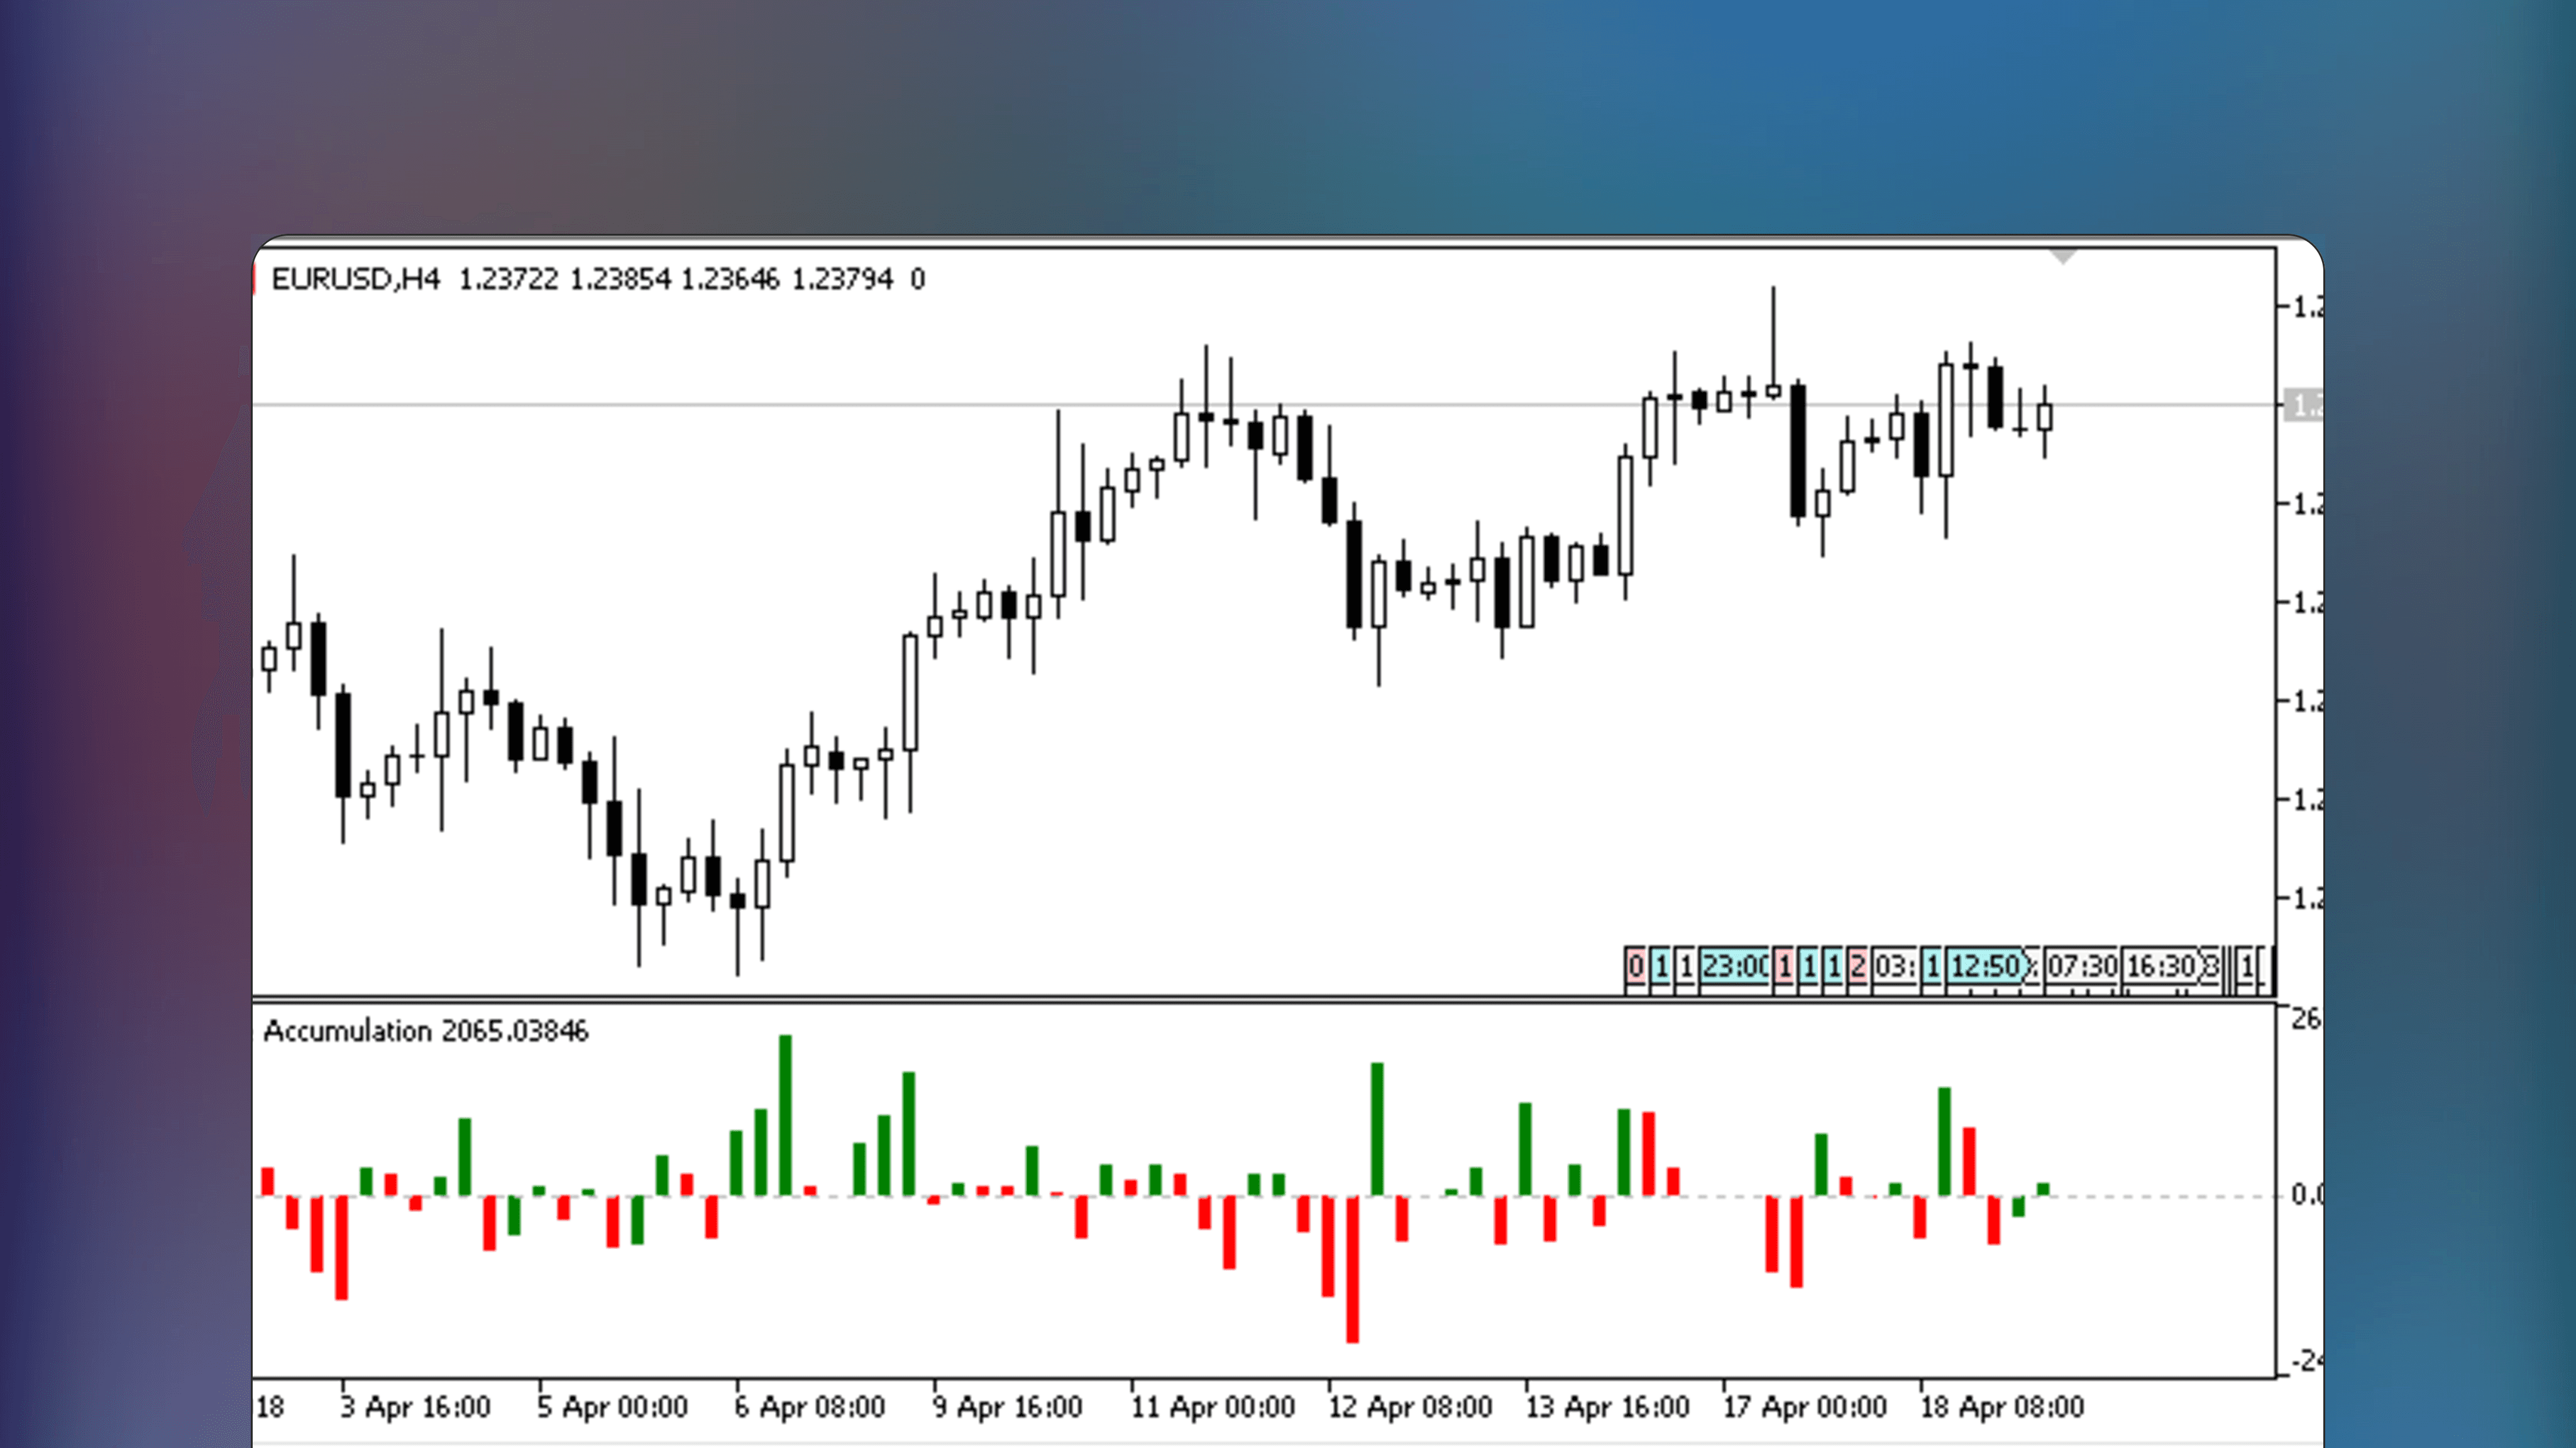
Volume_Accumulation
New
🔑
🌐
Volume_Accumulation is a MetaTrader Indicator that displays volume accumulation and distribution using a specialized formula. The indicator requires no inputs or settings, simply start using.
🤖
by twingall

Free
TradingView Indicator
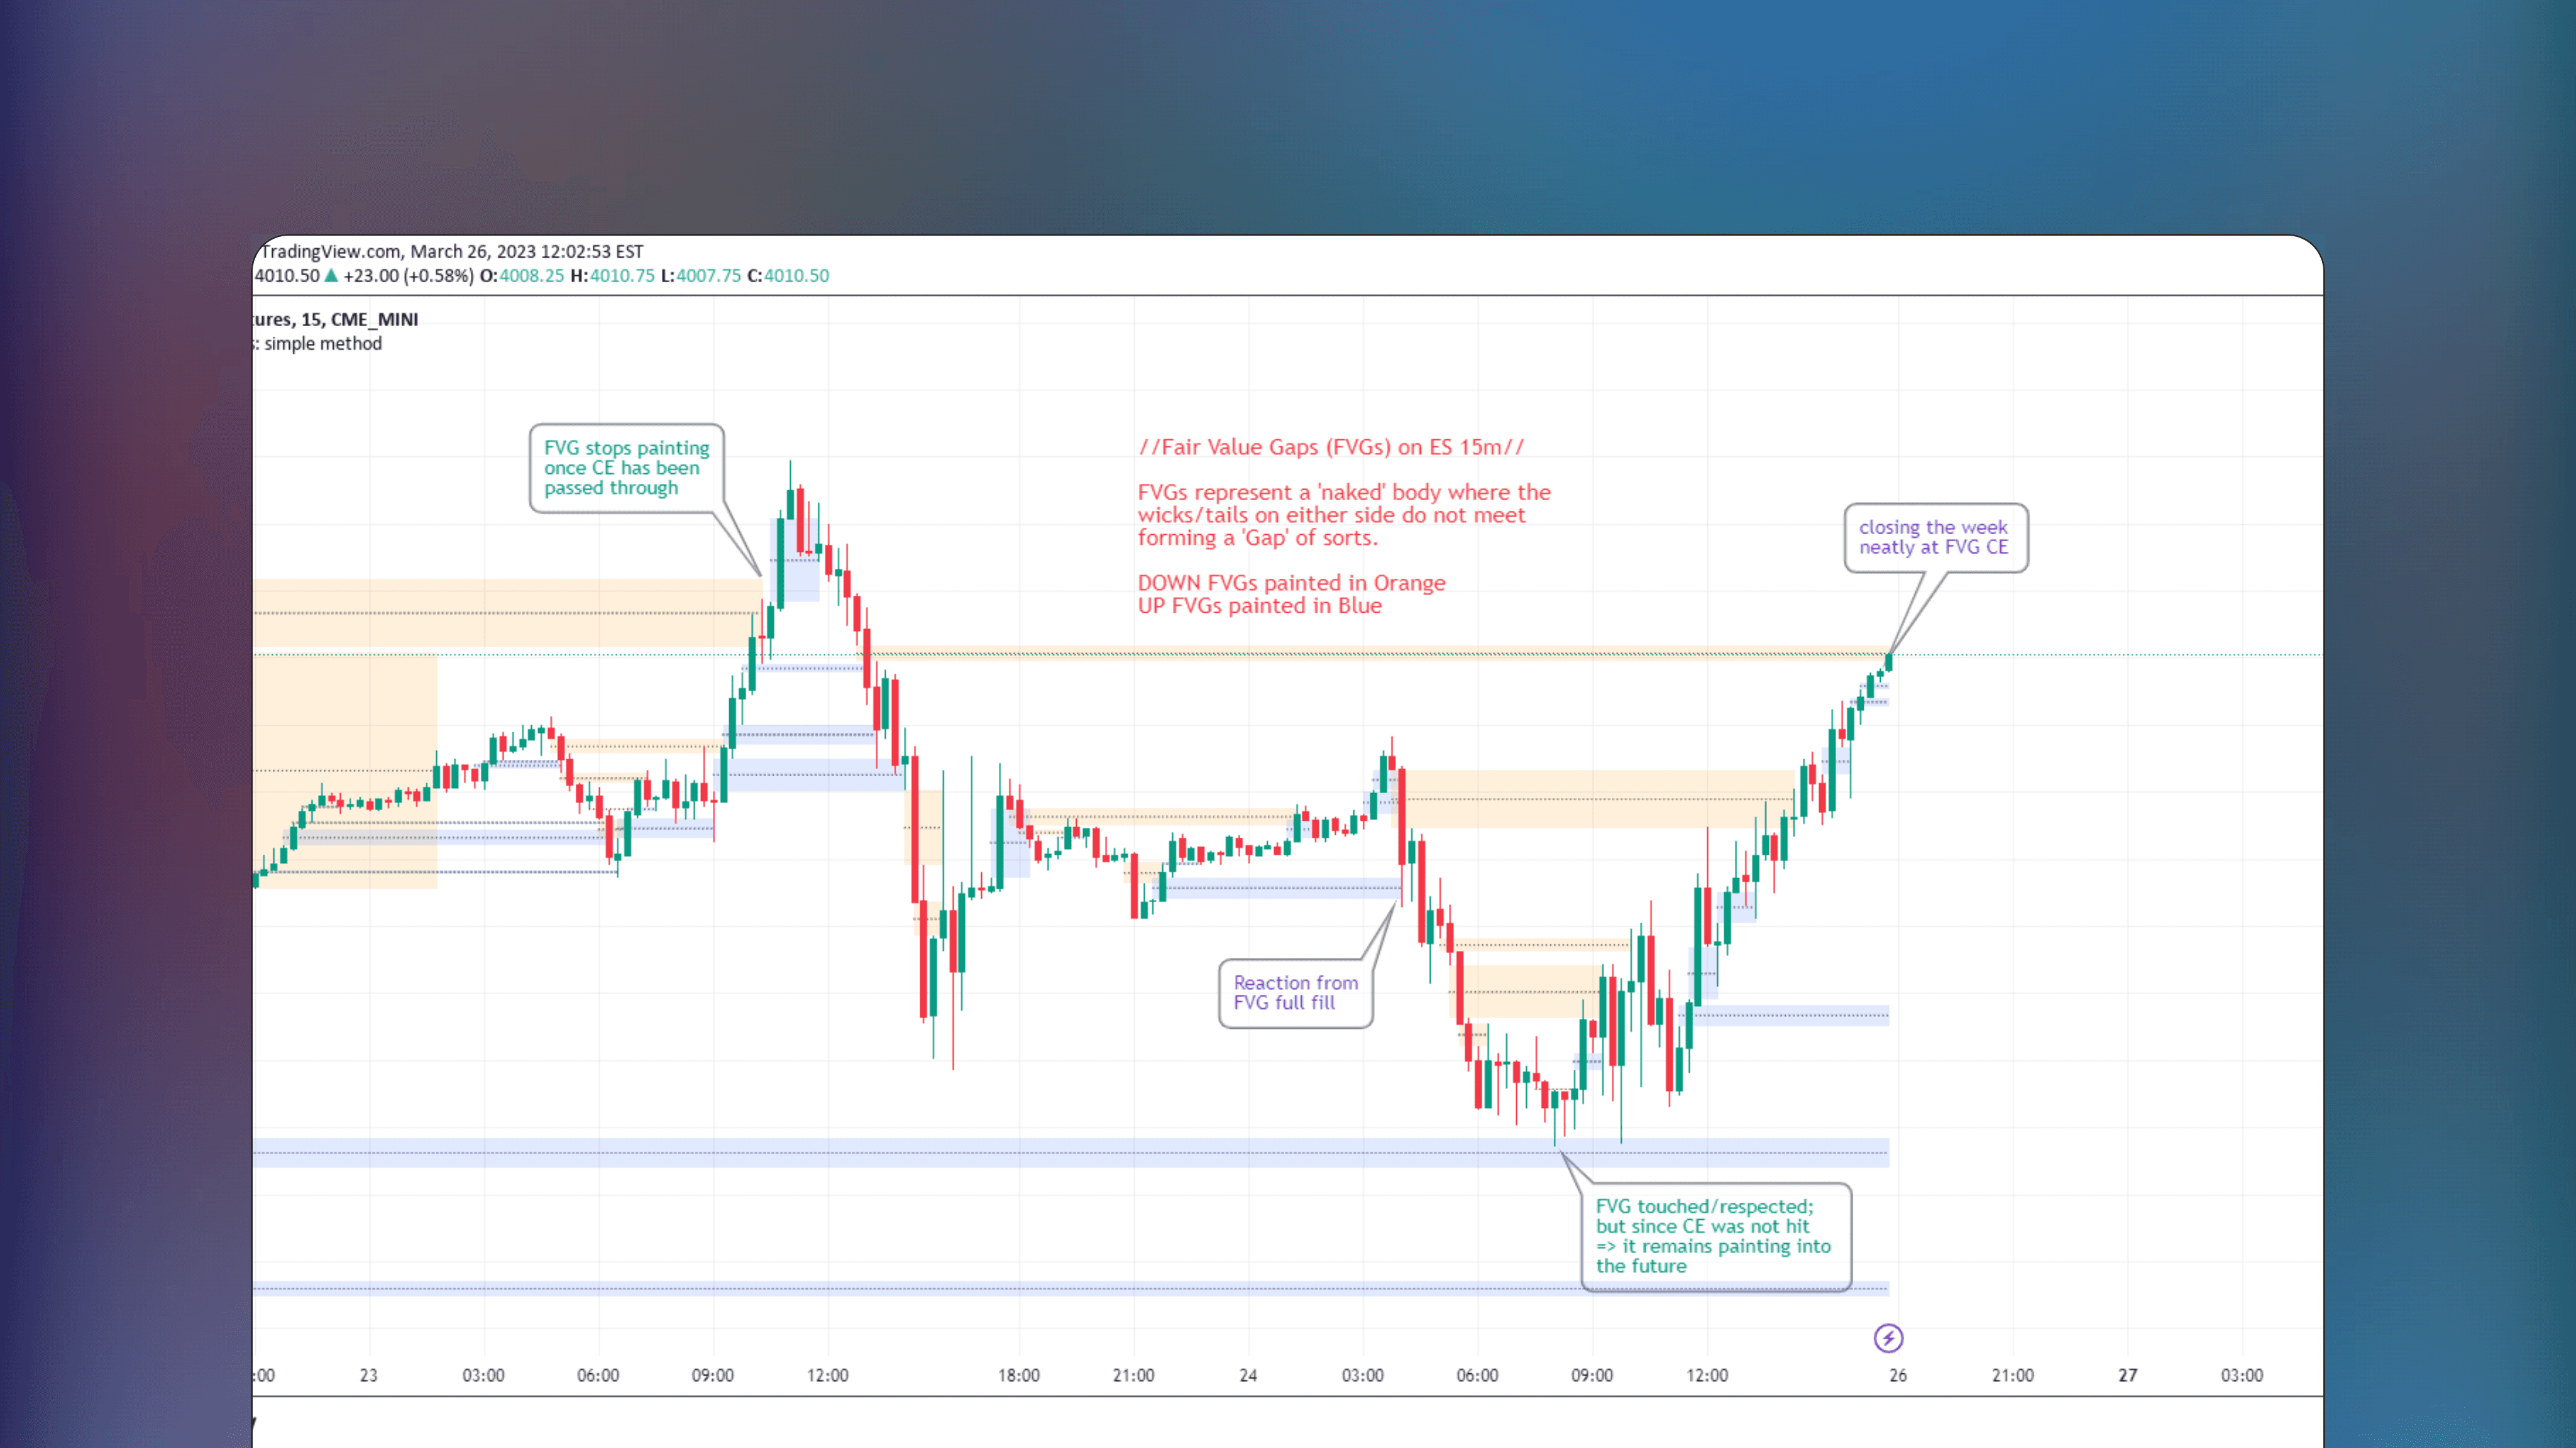
FVGs & CEs + Alerts: simple & efficient method
New
🔑
✅
FVGs & CEs + Alerts is a TradingView indicator that identifies and marks Fair Value Gaps and their midlines. Fair Value Gaps are not displayed when conditions like hitting a CE or fully filling the gap are met, decreasing clutter. Includes alerts for fills.
🤖
by benten
Free
ThinkOrSwim Indicator
Triple VWAP Indicator For ThinkOrSwim
New
🔑
✅
Triple VWAP Indicator for ThinkorSwim VWAP by adding 1 to 3 standard deviation bands alongside VWAP, providing a more detailed view of extreme deviations based on market volatility.
🤖
by scriptor
Free
MetaTrader Indicator
Volume_Accumulation
New
🔑
🌐
Volume_Accumulation is a MetaTrader Indicator that displays volume accumulation and distribution using a specialized formula. The indicator requires no inputs or settings, simply start using.
Load More
🤖
Similar Listings
Traders also viewed
All

🤖
by jdehorty
Free
TradingView Indicator
Machine Learning: Lorentzian Classification
🔑
✅
🏅
Machine Learning: Lorentzian Classification is an Indicator that uses the Lorentzian Distance Classifier machine learning algorithm to categorize historical price data for predicting future price movements.
🤖
by iravan
Free
TradingView Indicator
Equity Bond Currency Dashboard
🔑
🌐
✅
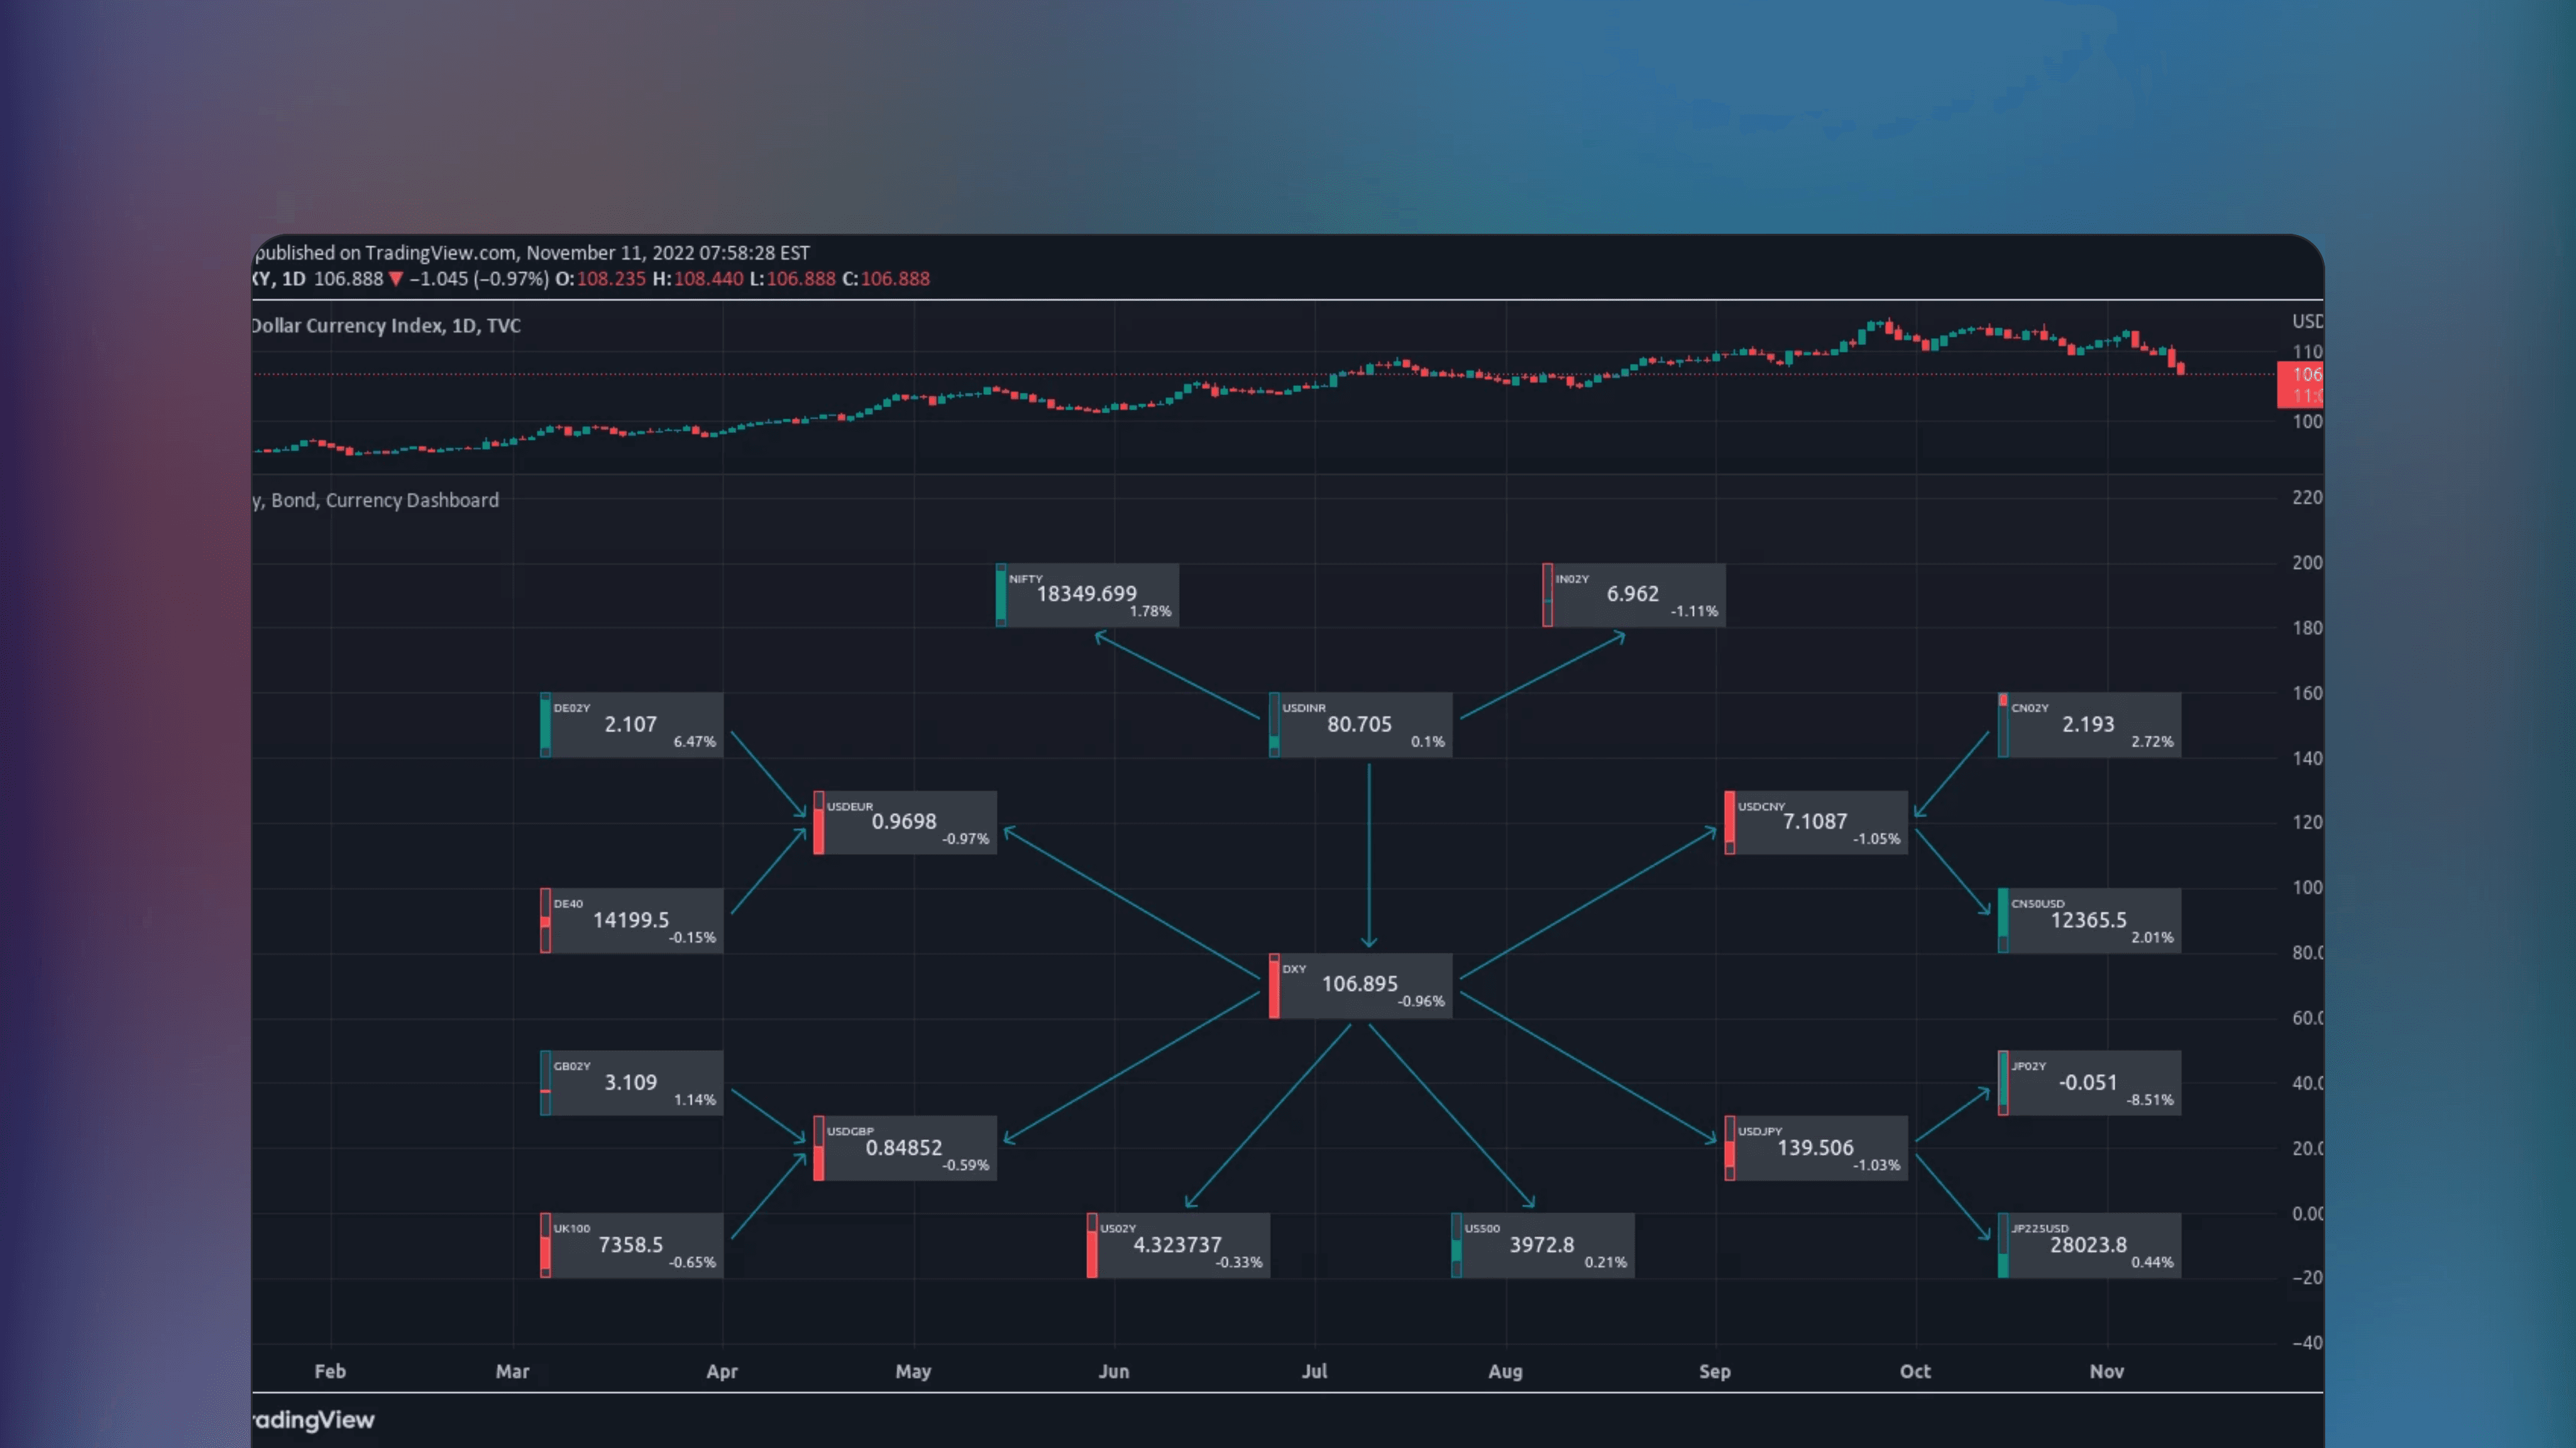
Equity Bond Currency Dashboard is a TradingView Indicator that visualizes demand-flow between equities, bonds and currencies across six countries, allowing track of institutional money flows and visuals for interconnected market dynamics.

🤖
by KioseffTrading
Free
TradingView Indicator
Fundamentals Graphing [Kioseff Trading]
🔑
✅
🏅
Fundamentals Graphing [Kioseff Trading] is a TradingView indicator that displays essential fundamental metrics for up to 40 stocks. It allows users to compare various key financial metrics like earnings and revenue for easy benchmarking.

🤖
by KioseffTrading
Free
TradingView Indicator
Monte Carlo Simulation - Your Strategy [Kioseff Trading]
🔑
🌐
✅
🏅
Monte Carlo Simulation - Your Strategy by Kioseff Trading is a free TradingView indicator that leverages Monte Carlo simulations to analyze the variability and potential outcomes of your inputted trading strategies or the assets displayed on your chart. Calculate your luck factor using this indicator.

🤖
by KioseffTrading
Free
TradingView Indicator
The Next Pivot [Kioseff Trading]
🔑
🌐
🏅
The Next Pivot [Kioseff Trading] is a TradingView indicator that employs similarity measures to compare historical price sequences with current data, formulating potential paths for future price action.

🤖
by KioseffTrading
Free
TradingView Indicator
(Quartile Vol.; Vol. Aggregation; Range US Bars; Gaps) [Kioseff]
🔑
🏅
The (Quartile Vol.; Vol. Aggregation; Range US Bars; Gaps) [Kioseff] Indicator is a TradingView tool that analyzes price action and volume by breaking volume into aggregated quartiles for noise filtered price and volume analysis.

🤖
by tradeforopp
Free
TradingView Indicator
Seasonality [TFO]
🔑
🌐
✅
🏅
Seasonality [TFO] is a TradingView indicator that analyzes an asset's average performance across daily, monthly, and quarterly timeframes. It uses a 252-trading day calendar, aggregating daily data into 21-day months and 63-day quarters for gauging seasonal trends.

🤖
by KioseffTrading
Free
TradingView Indicator
Crypto Terminal [Kioseff Trading]
🔑
🌐
🏅
Crypto Terminal [Kioseff Trading] is a TradingView indicator that uses on-chain data to provide real-time cryptocurrency statistics directly on your Tradingview charts.

🤖
by toodegrees
Free
TradingView Indicator
Seasonal Open Interest° by toodegrees
🔑
🌐
✅
🏅
Seasonal Open Interest° by toodegrees is a TradingView Indicator that displays the daily number of outstanding futures contracts for specific commodities and markets, based on Open Interest data released after each trading day.
🤖
by pAulseperformance
Free
TradingView Indicator
Portfolio Backtester Engine
🔑
🌐
✅
🏅
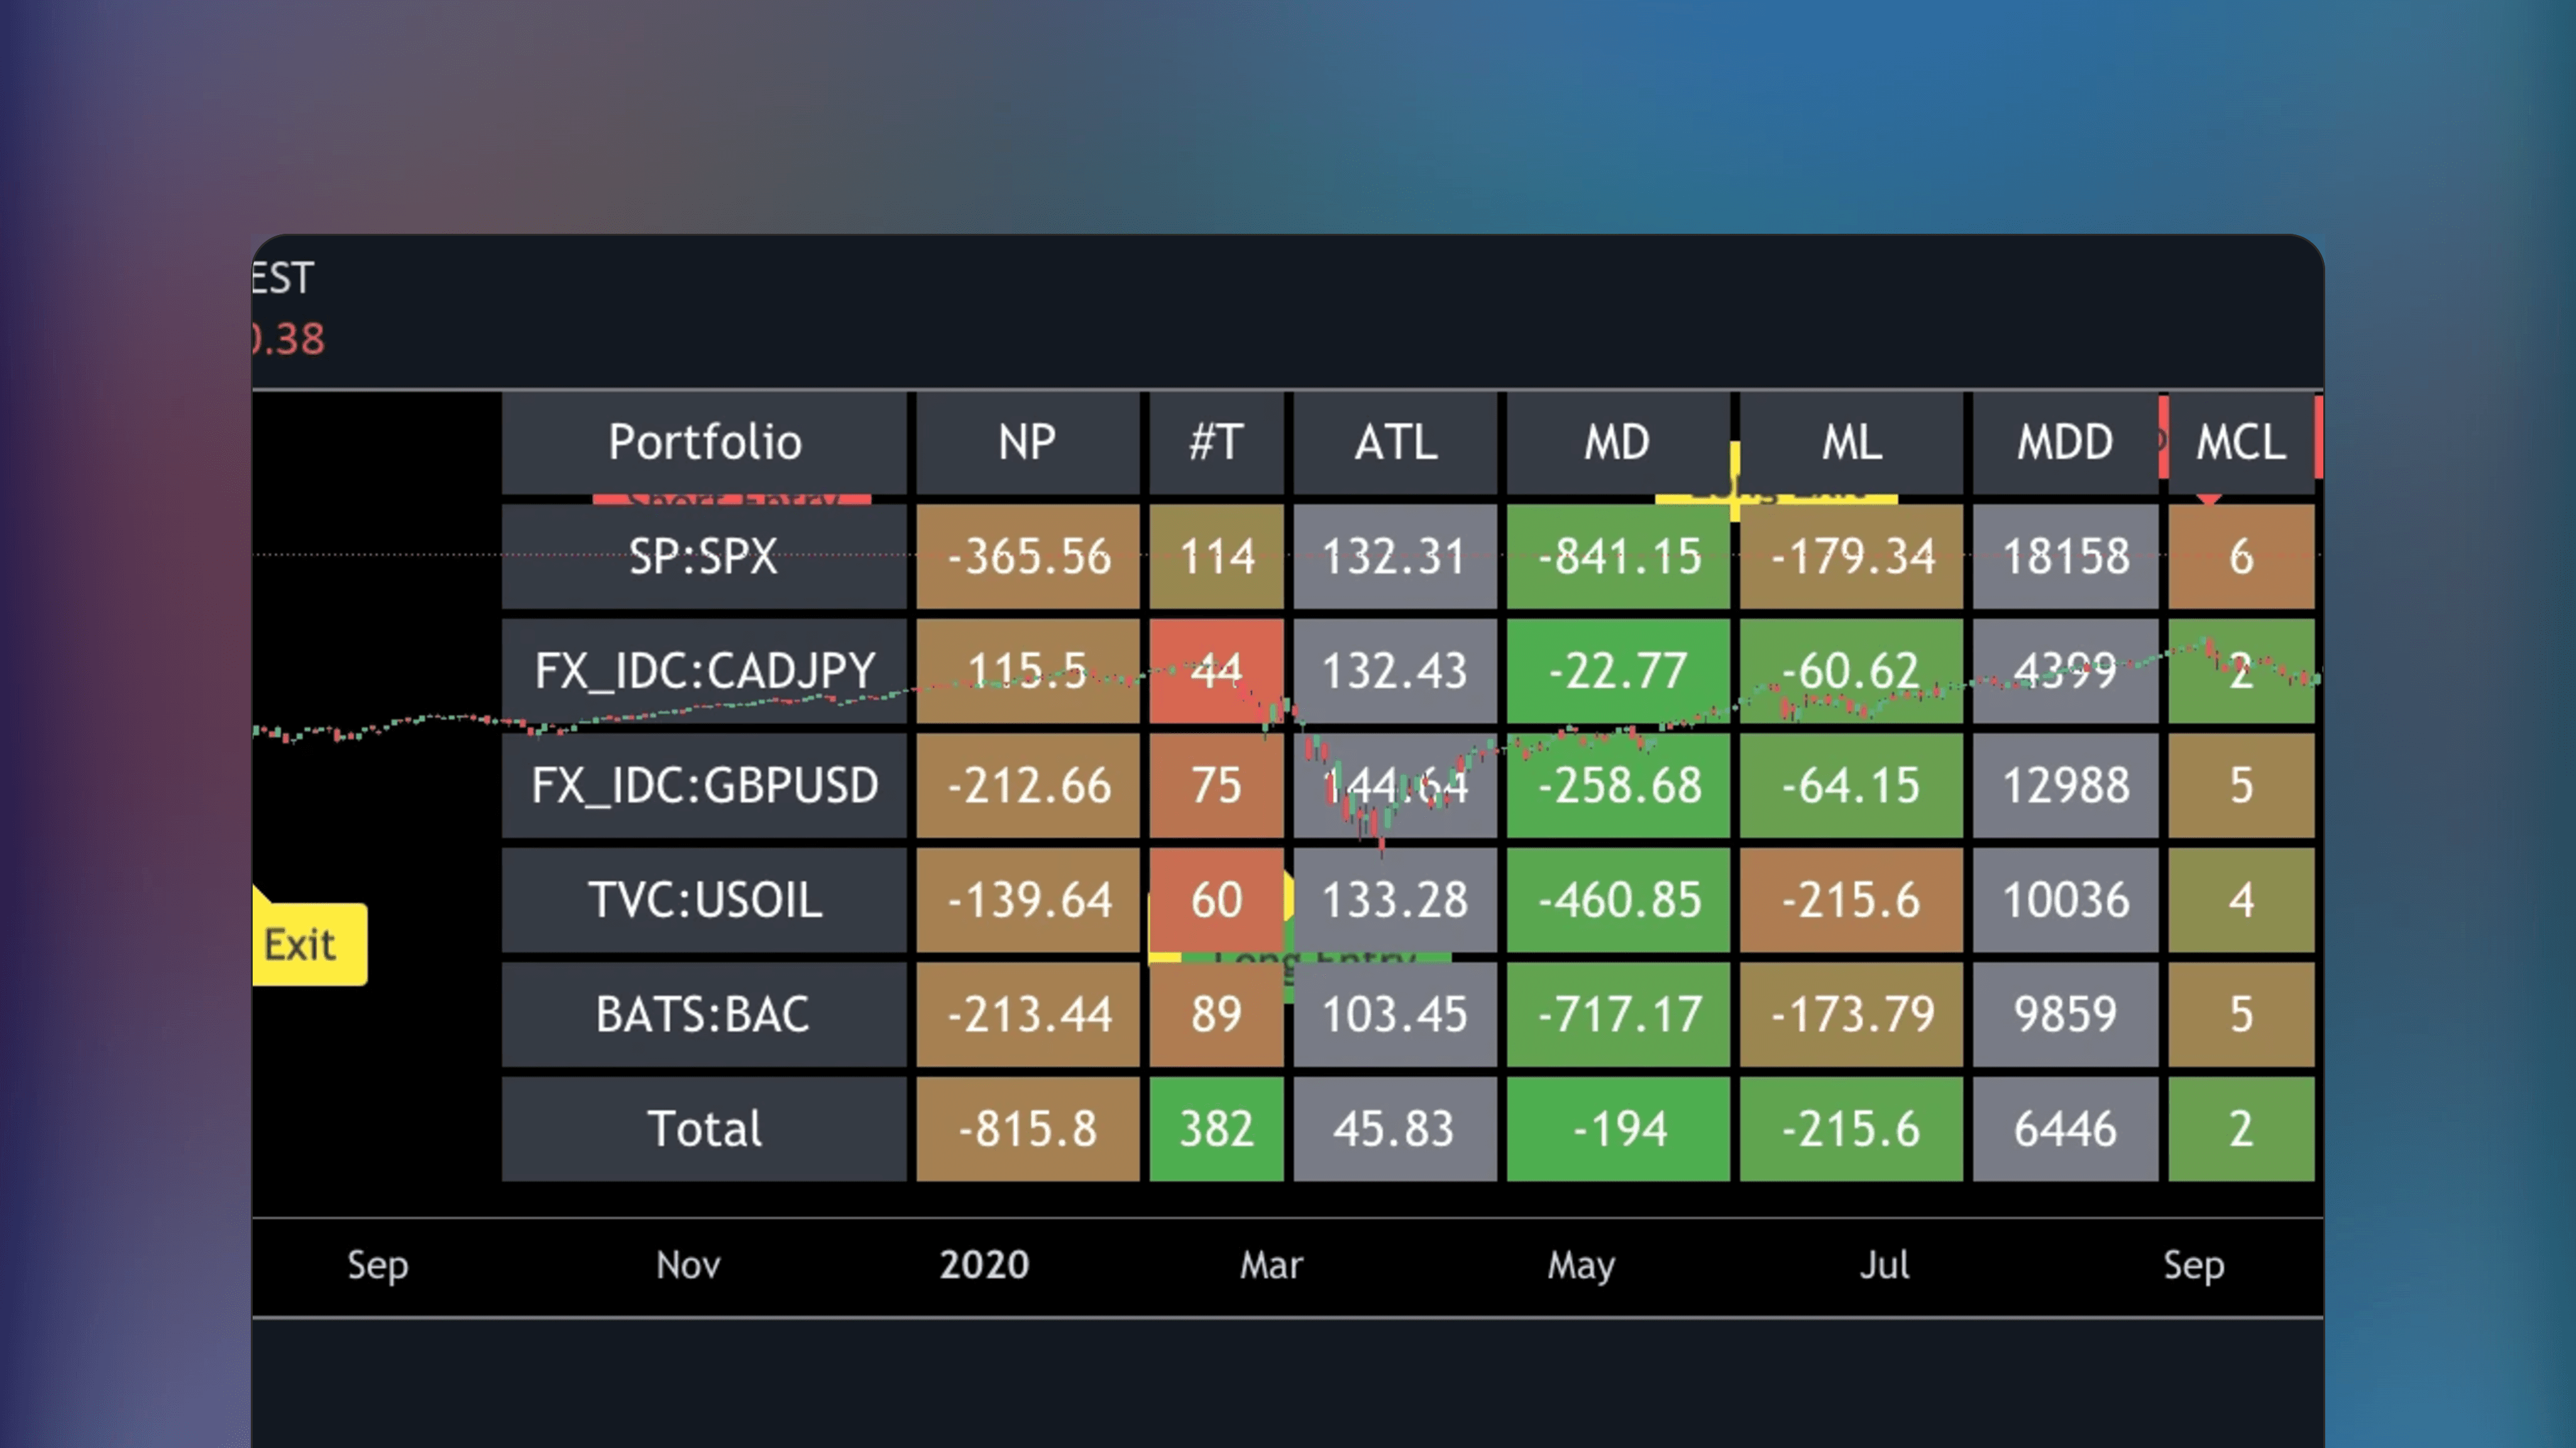
Portfolio Backtester Engine is a TradingView indicator that enables backtesting trading strategies across multiple symbols simultaneously. Adapted from PineCoders’ engine, it retains all key functionalities while offering simultaneous backtesting in one go.
🤖
by KioseffTrading
Free
TradingView Indicator
Portfolio Laboratory [Kioseff Trading]
🔑
✅
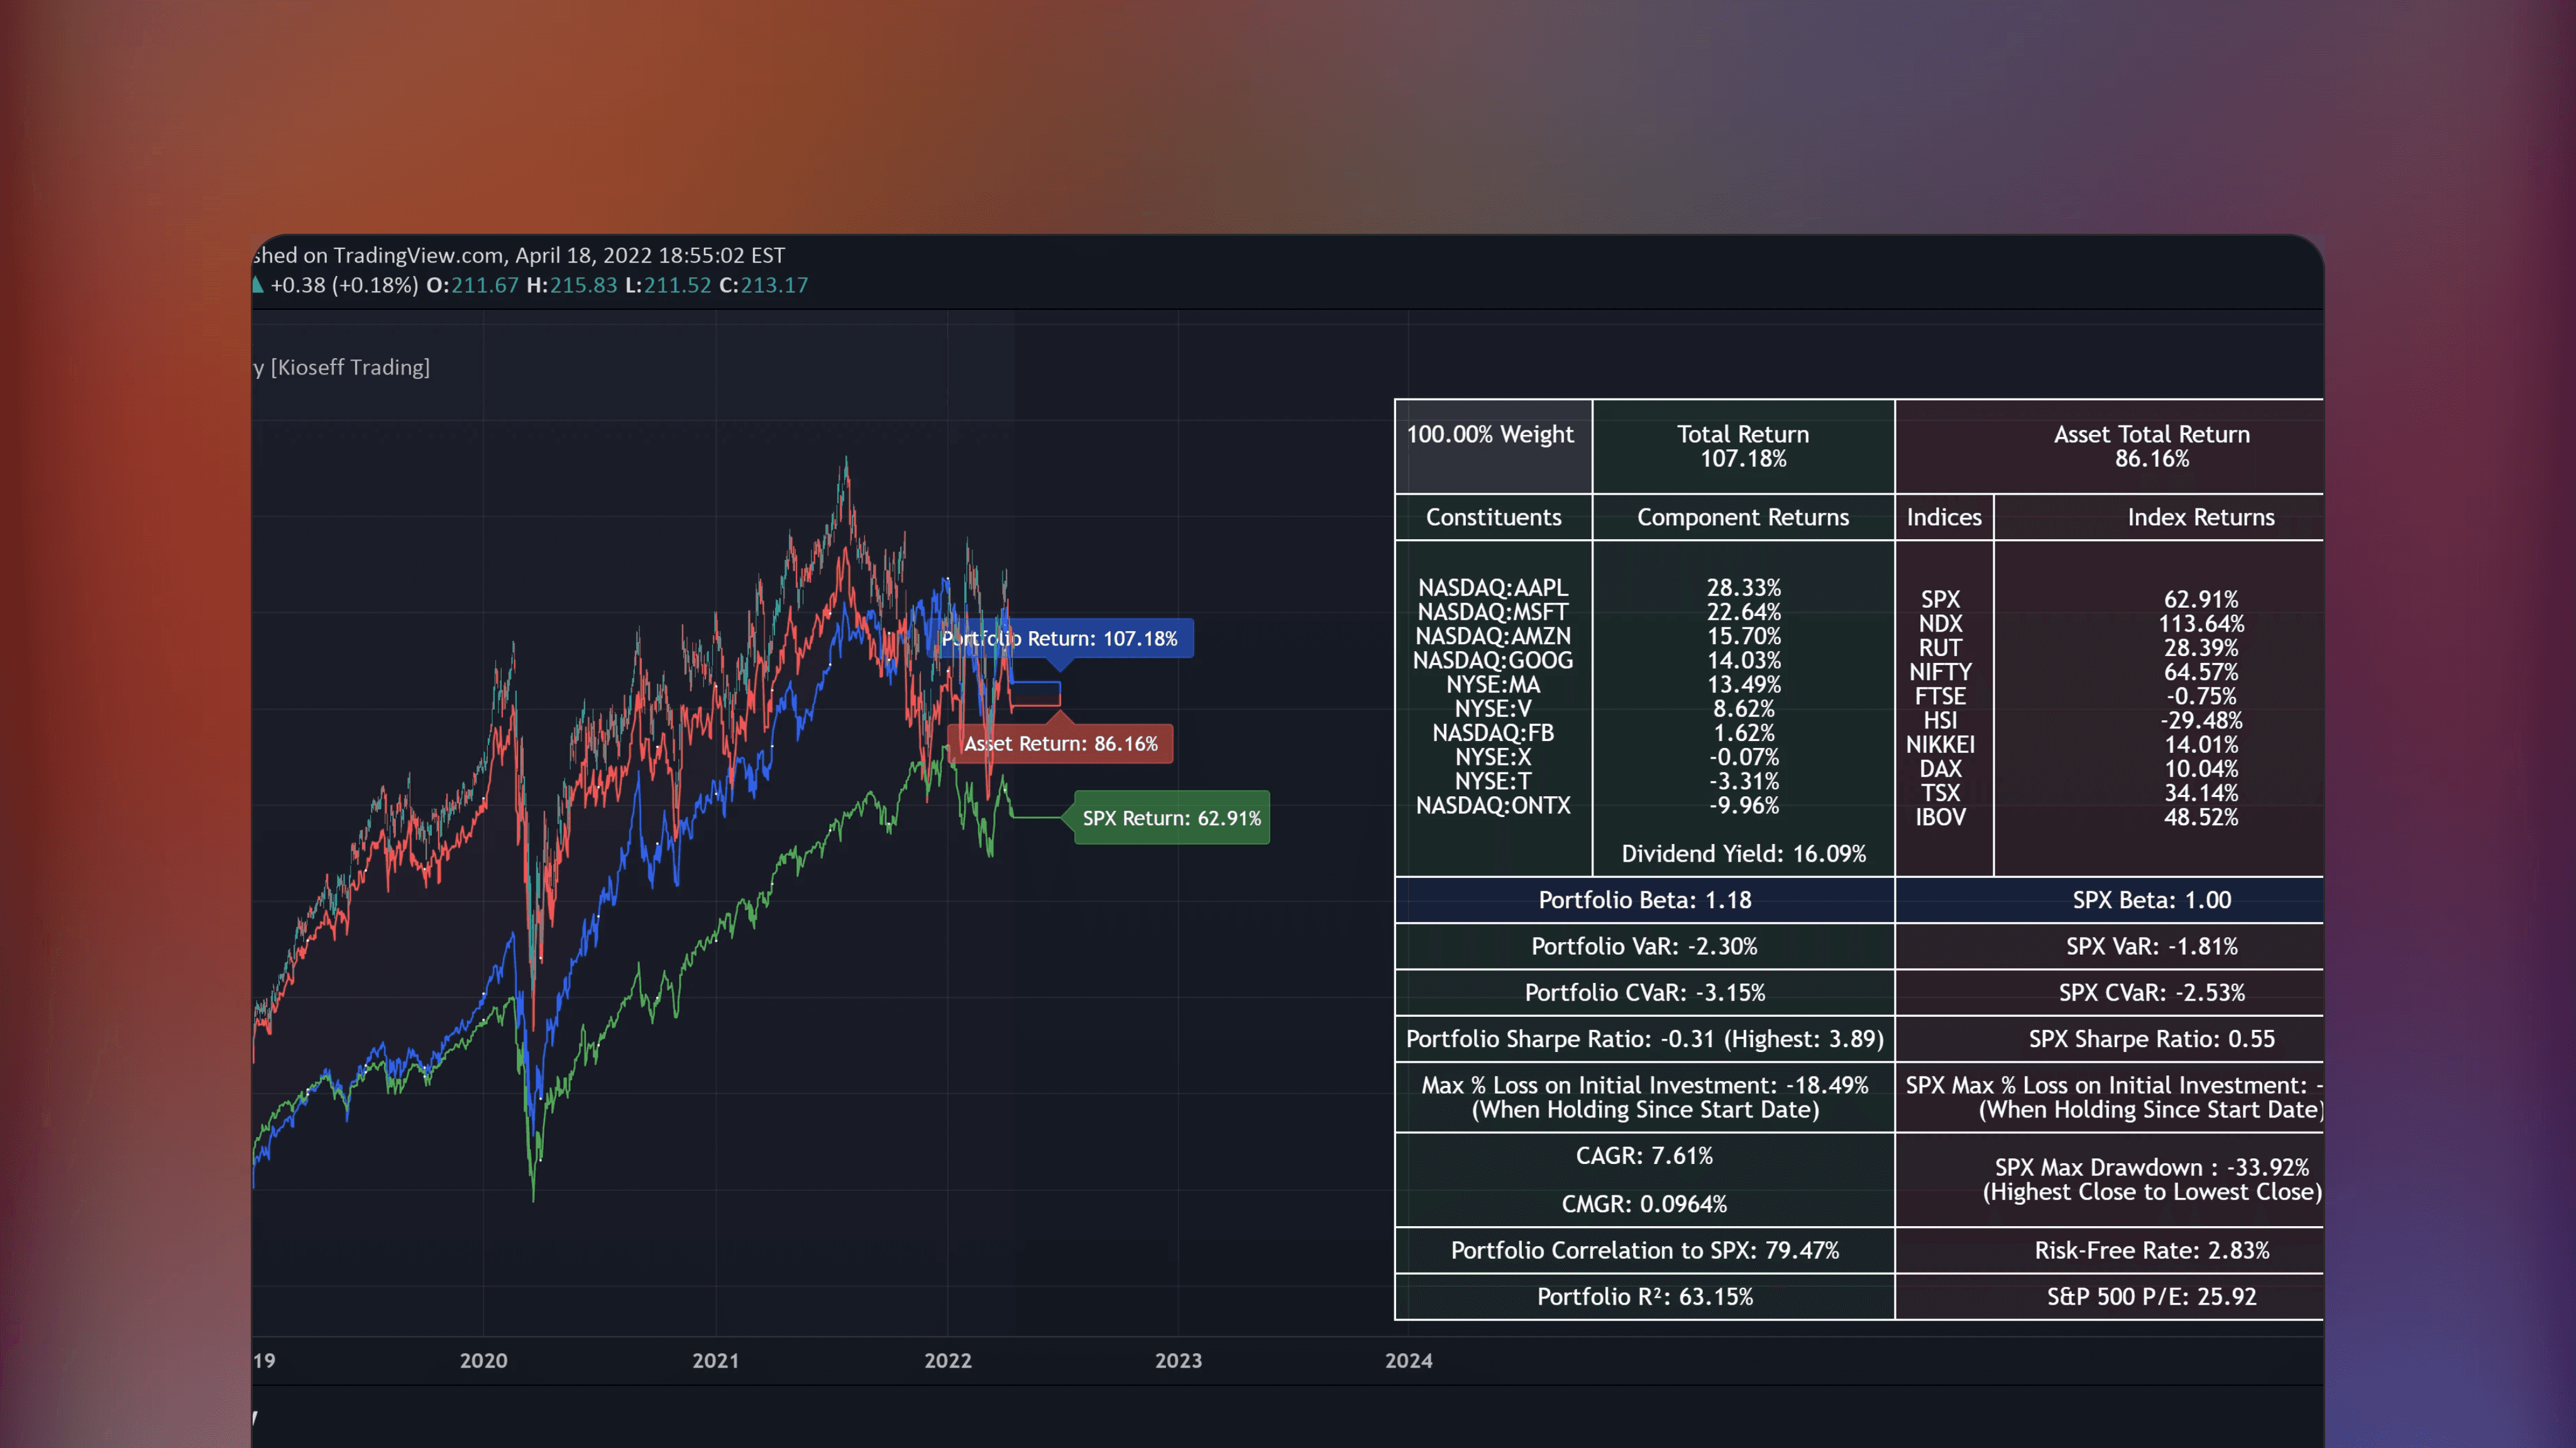
Portfolio Laboratory [Kioseff Trading] is a free TradingView Indicator that analyzes historical portfolio performance using weighted percentage changes and provides comparison to popular indices as well as various risk metrics.
🤖
by reees
Free
TradingView Indicator
Harmonic Pattern Detection, Prediction, and Backtesting Tool
🔑
🌐
The Harmonic Pattern Detection, Prediction, and Backtesting Tool is a free TradingView indicator that automatically identifies and predicts harmonic XABCD patterns and allows users to backtest signals generated by them.
🤖
by tradeforopp
Free
TradingView Indicator
Captain Backtest Model [TFO]
🔑
Captain Backtest Model [TFO] is a TradingView indicator created by @imjesstwoone and @mickey1984. It uses a systematic model to capture market expansions during the 10:00-14:00 EST 4-hour timeframe with three simple steps and adjustable settings based on the NQ 5m example.
🤖
by MUQWISHI
Free
TradingView Indicator
Annual Returns % Comparison [By MUQWISHI]
🔑
🌐
✅
🏅
Annual Returns % Comparison [By MUQWISHI] is a free TradingView indicator that benchmarks the historical annual percentage change between two symbols using a simple to understand column visualization.

🤖
by SegaRKO
Free
TradingView Indicator
Black-Scholes Options Pricing Model
🔑
🌐
✅
The Black-Scholes Options Pricing Model is a TradingView indicator that applies the Black-Scholes formula to determine the theoretical value of options. Features all important greeks, such as Delta, Gamma, Theta, Vanna and more.
🤖
by toodegrees
Free
TradingView Indicator
ICT Commitment of Traders° by toodegrees
🔑
🌐
✅
The ICT Commitment of Traders° by toodegrees is a TradingView indicator that analyzes weekly CFTC Commitment of Traders reports, displaying the long and short positions of three key market participants: commercial traders, large traders and small speculators.

🤖
by toodegrees
Free
TradingView Indicator
Interest Rate and GDP Dashboard by toodegrees
🔑
🌐
✅
🏅
Interest Rate and GDP Dashboard by toodegrees is a TradingView Indicator that aggregates interest rates and GDP data from major Central Banks into one view for timely nsights into key economic metrics.

🤖
by Steversteves
Free
TradingView Indicator
AR Forecast Scatterplot [SS]
🔑
✅
AR Forecast Scatterplot [SS] is a free TradingView Indicator that calculates and visualizes forecasted trends using statistical methods based on historical price data.
🤖
by ChartPrime
Free
TradingView Indicator
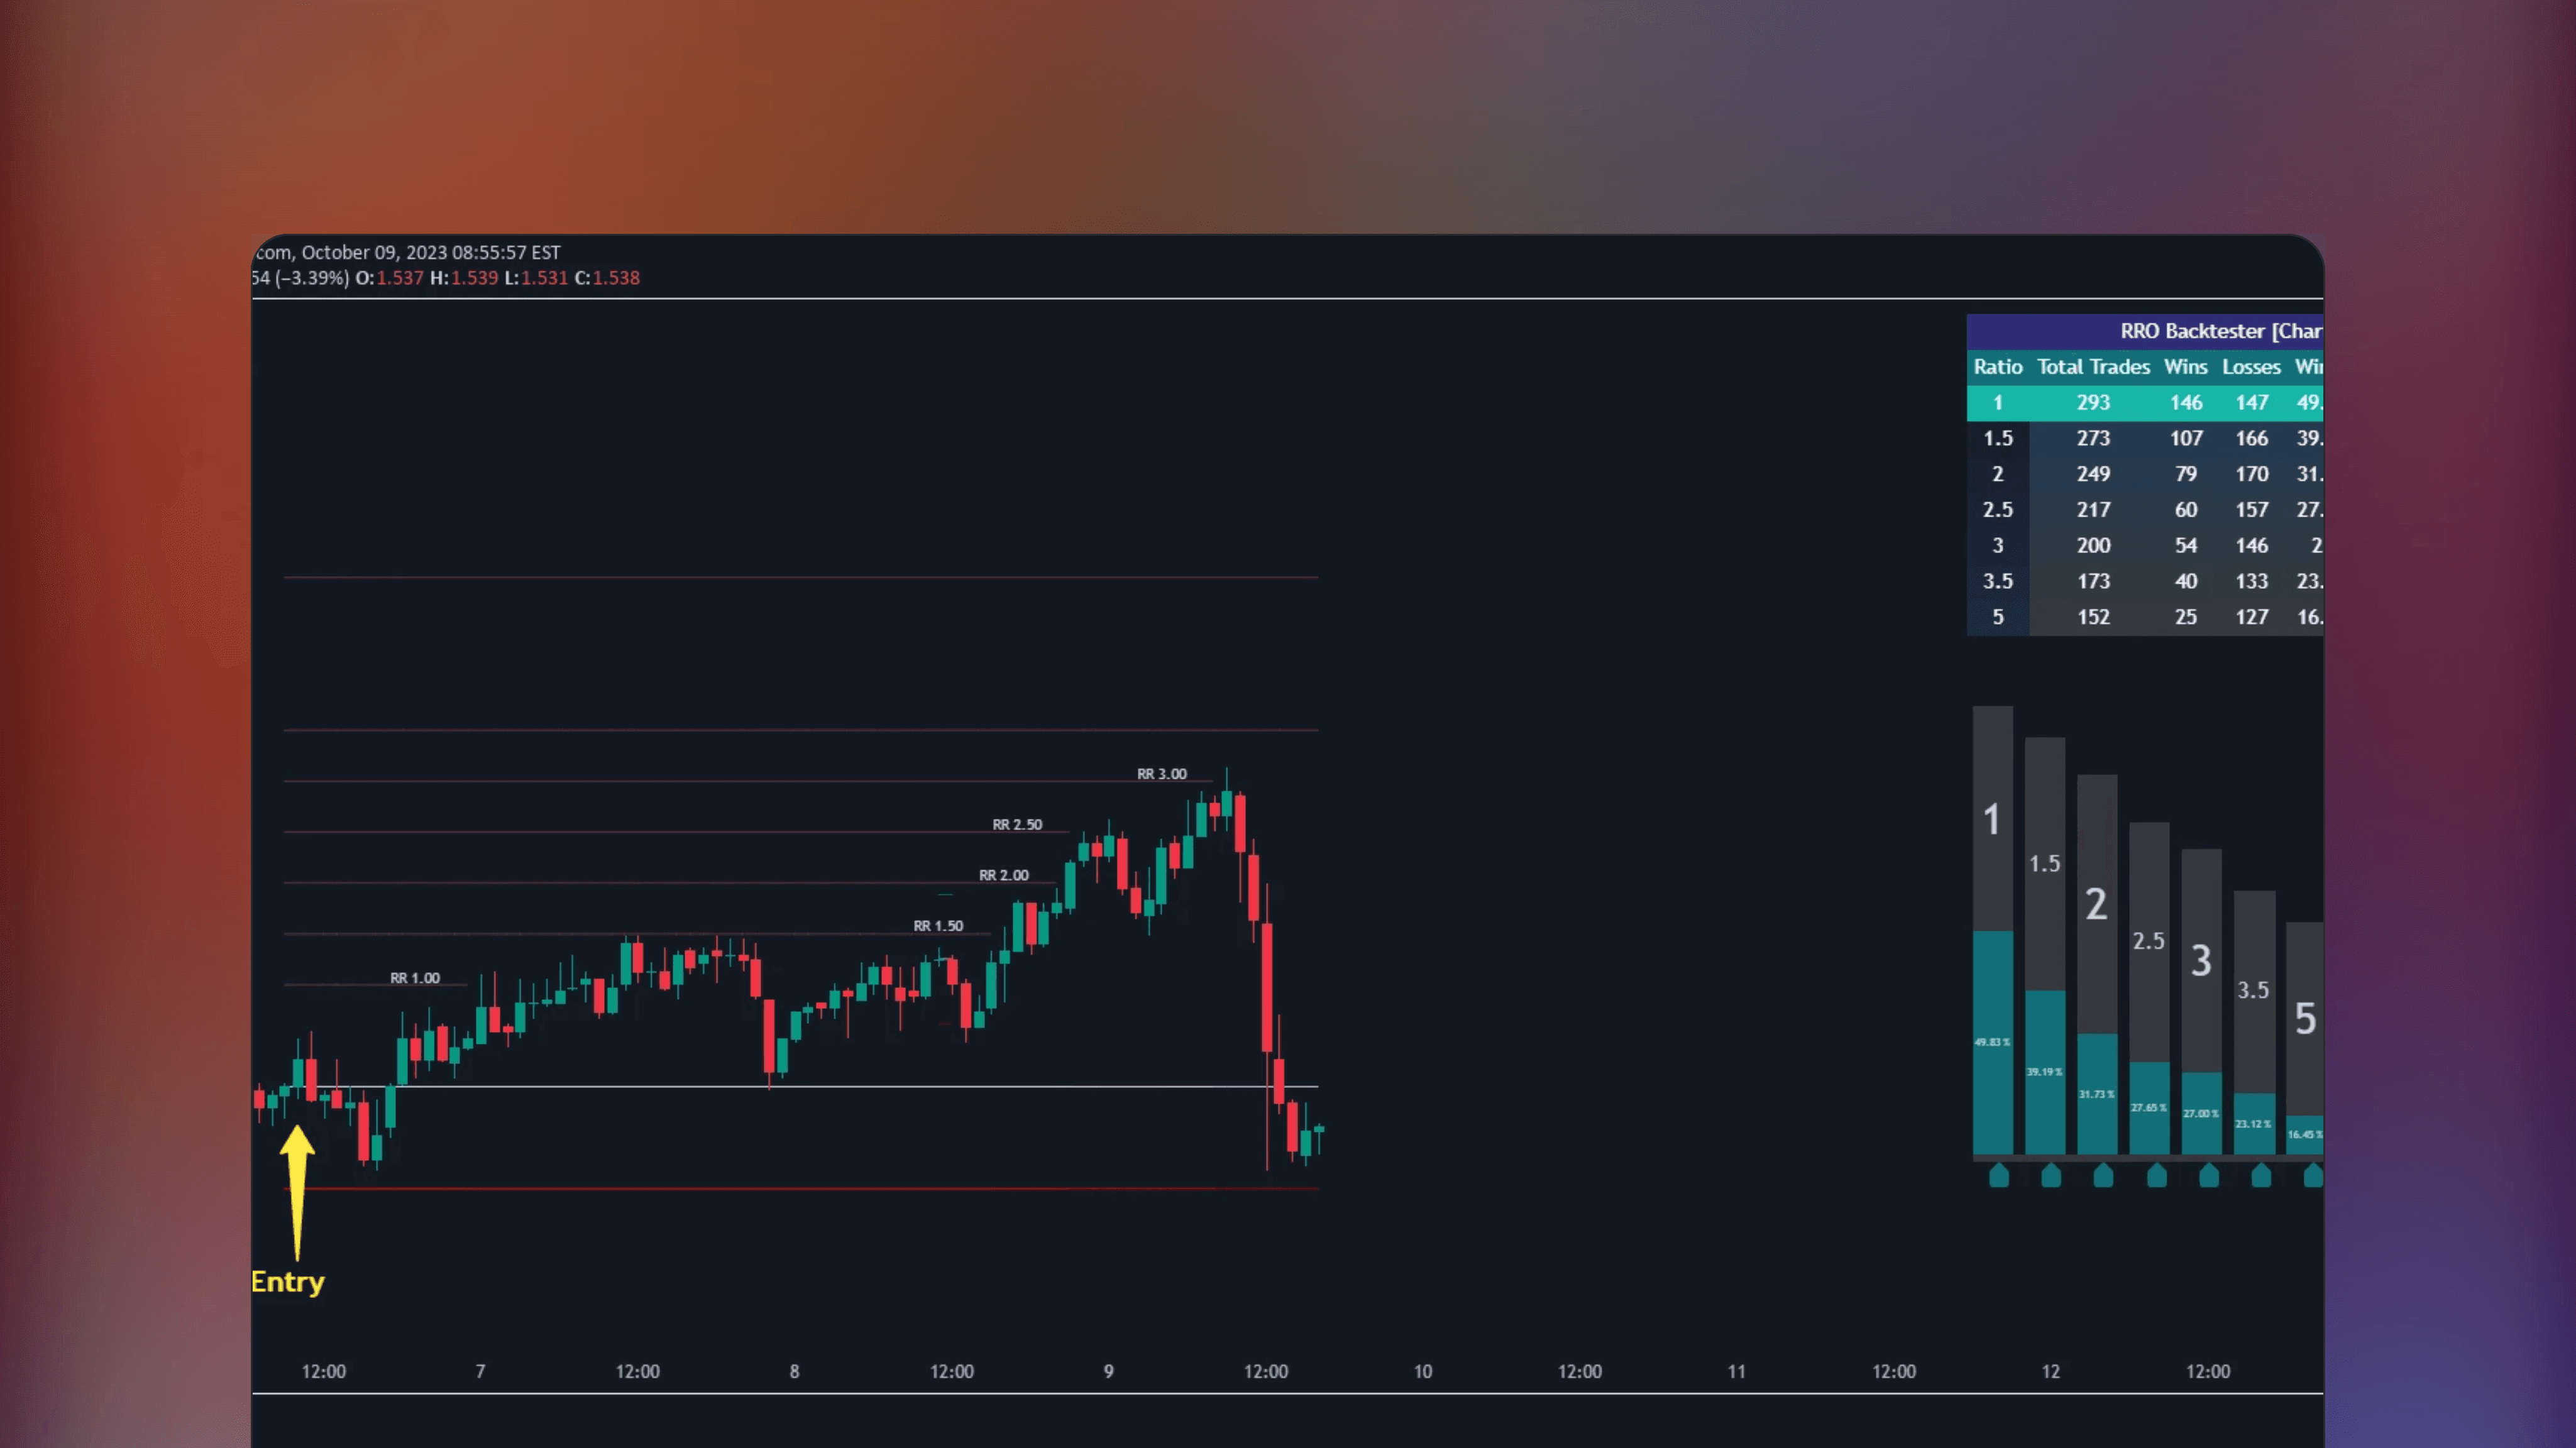
Risk Reward Optimiser [ChartPrime]
🔑
🌐
🏅
Risk Reward Optimiser [ChartPrime] is a TradingView Indicator that automates the optimization of risk-reward ratios using a variety of different benchmarks.
🤖
by roamin129
Free
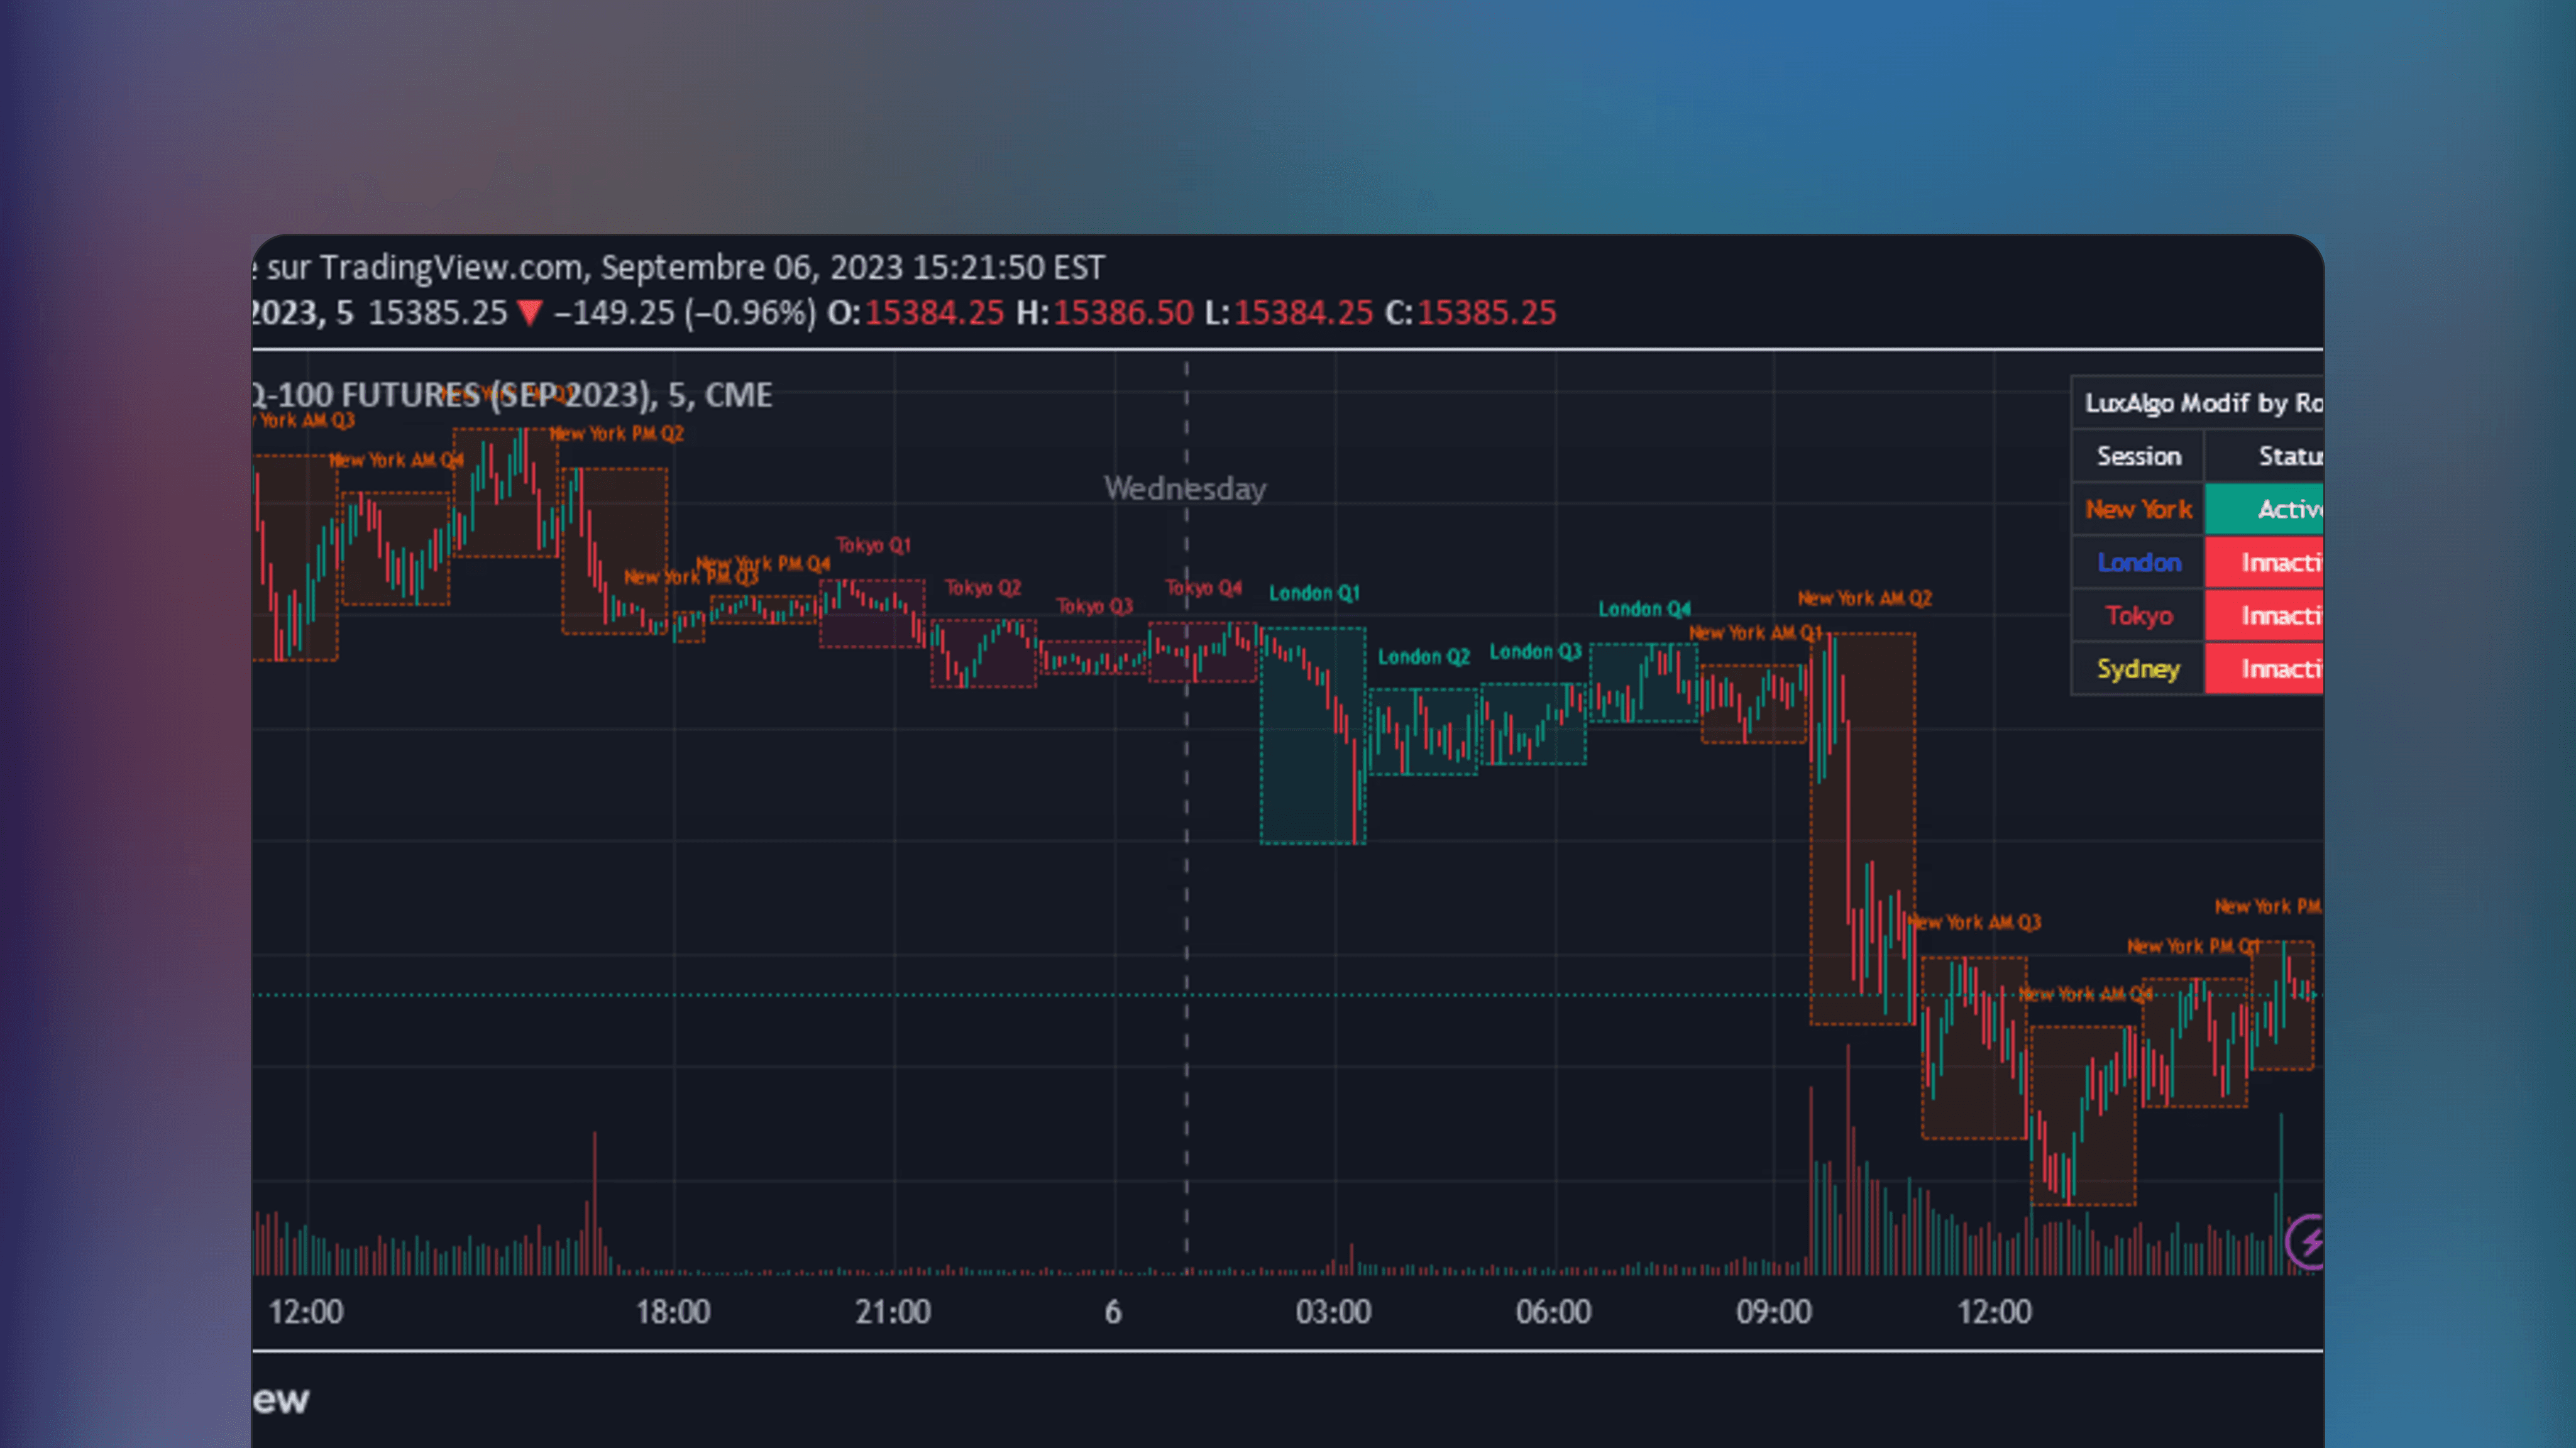
TradingView Indicator
AMDX Time Zone
🔑
AMDX Time Zone is a TradingView indicator based on Accumulation and Manipulation theory, highlighting extreme price levels within specific time zones and trading sessions, also known as kill zones.

🤖
by BarefootJoey
Free
TradingView Indicator
Astro: Planetary Aspect Table
🔑
Astro: Planetary Aspect Table is a free TradingView indicator that maps planetary angles between, showing their positions in an easy to read dashboard. An experimental indicator displaying potential celestial influences on Earth events and financial markets.

🤖
by MUQWISHI
Free
TradingView Indicator
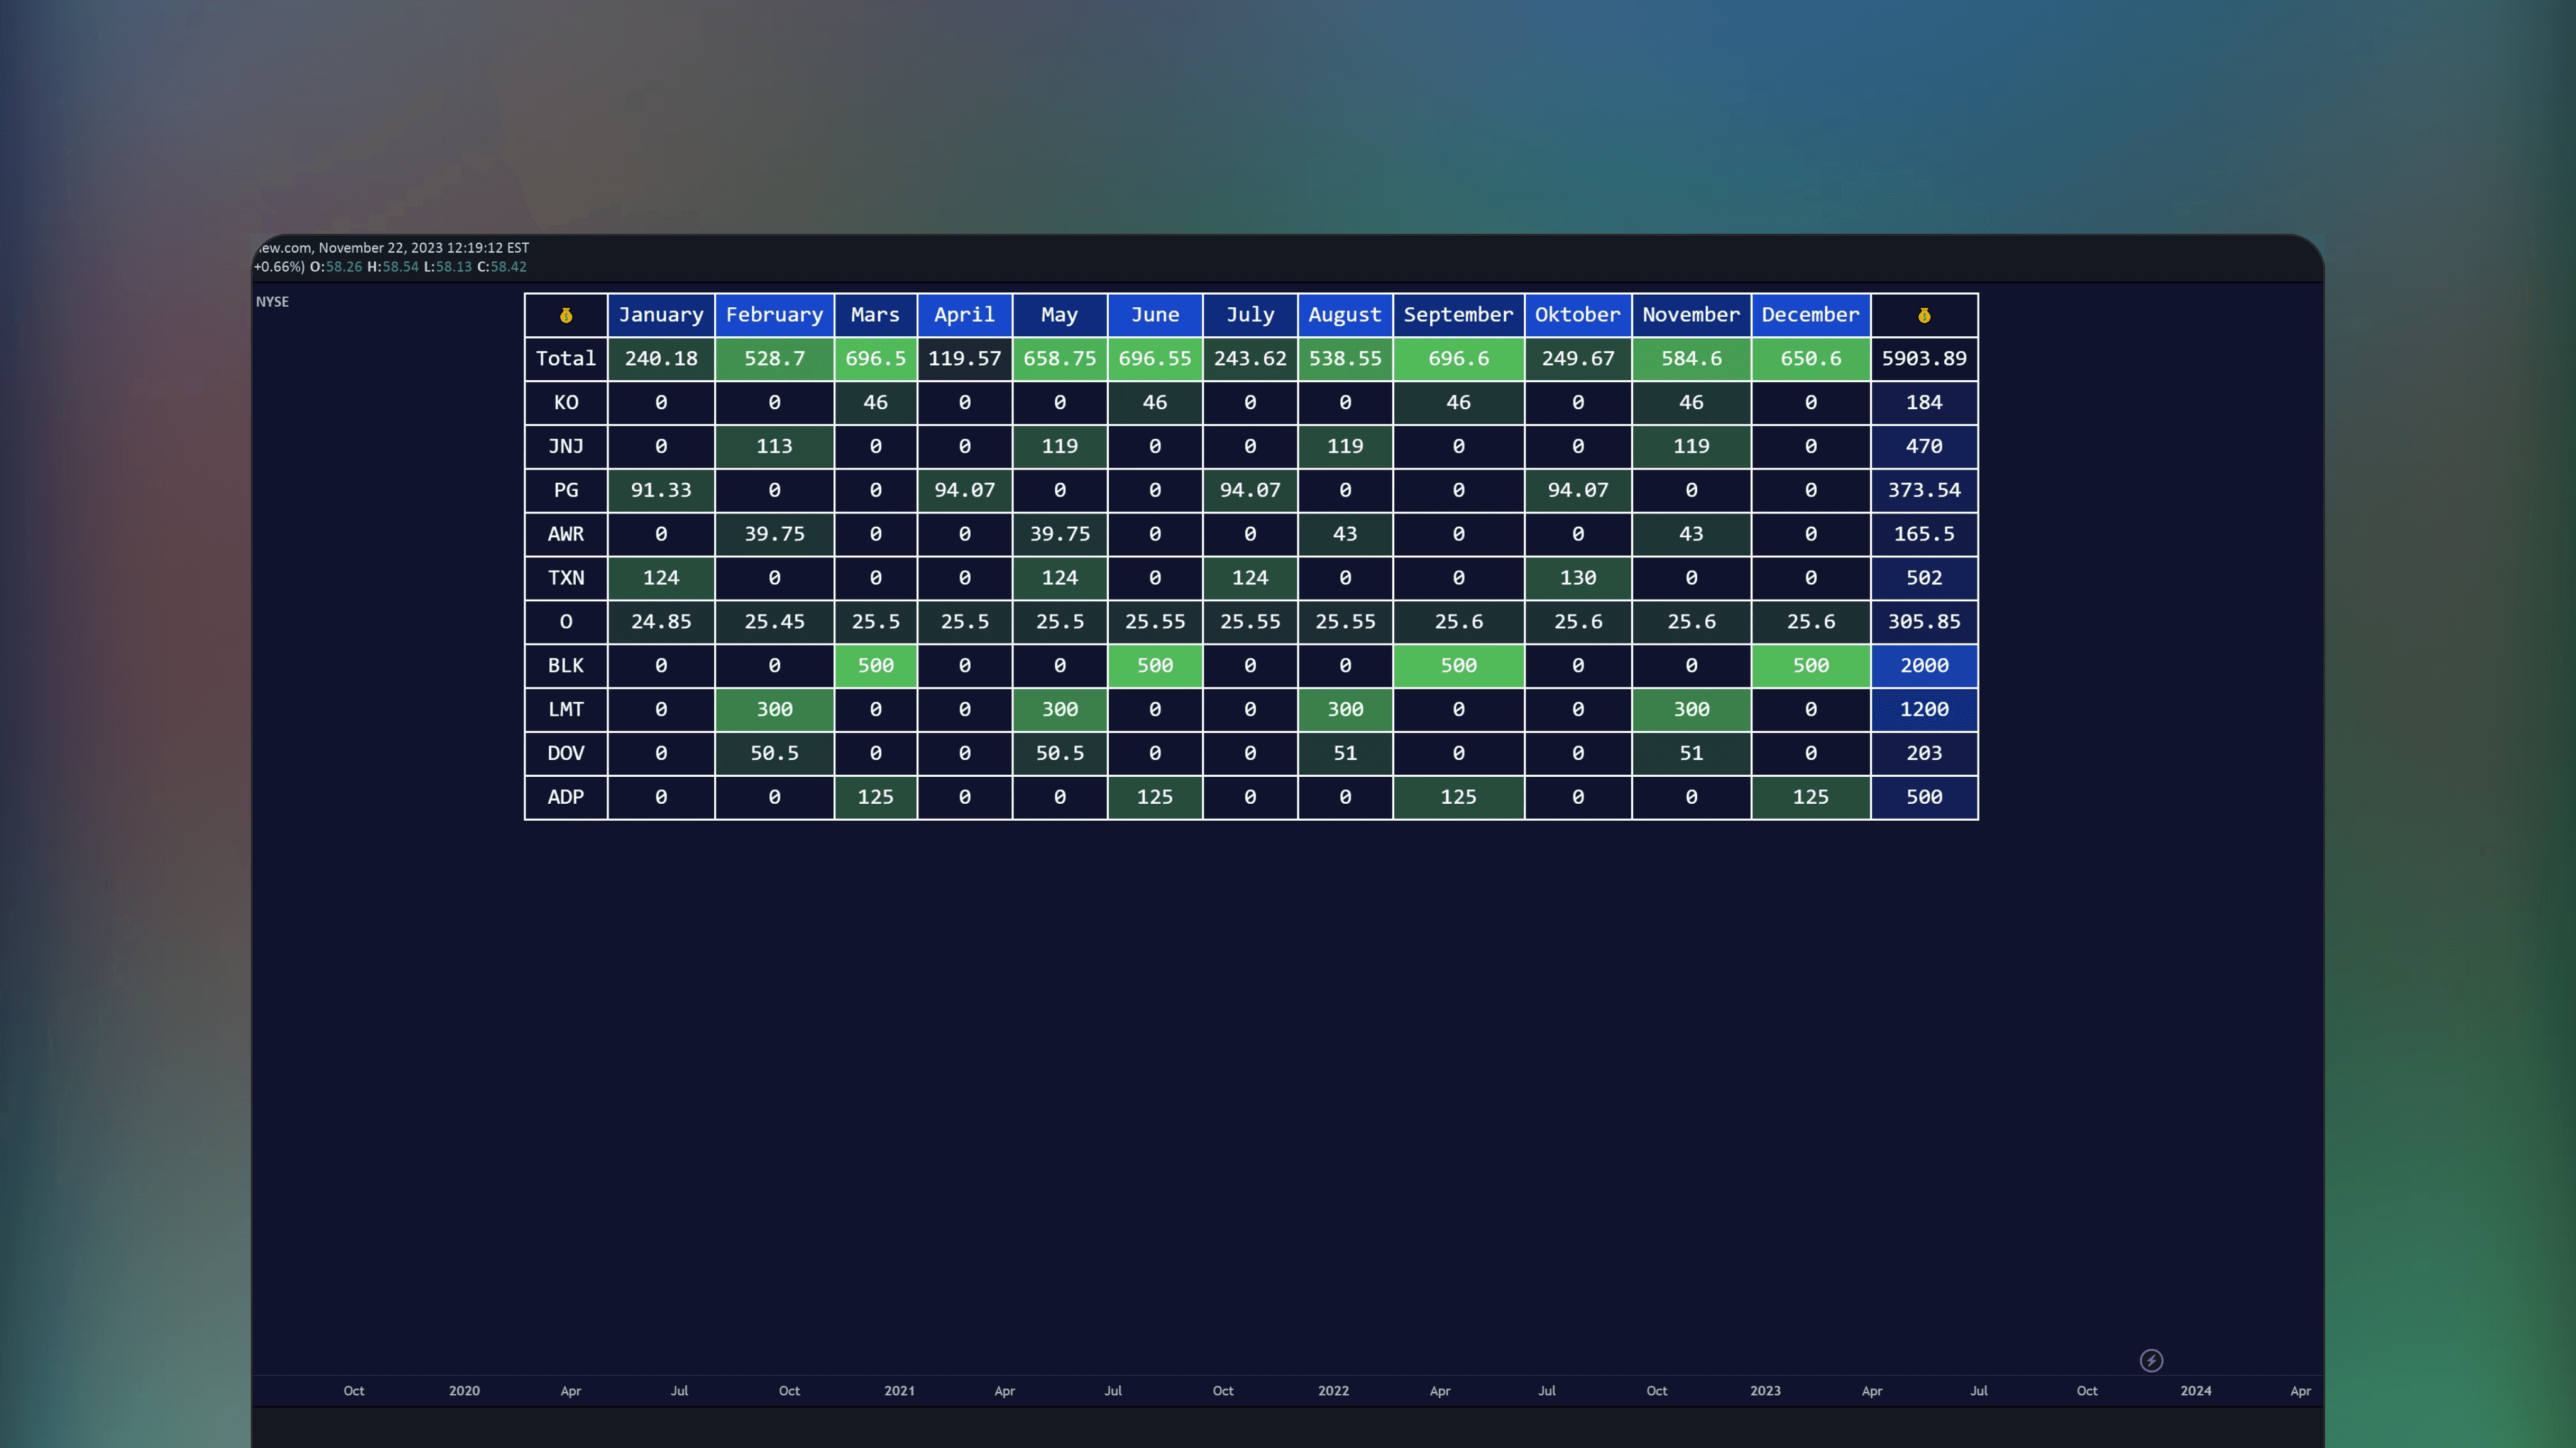
Financial Data Spreadsheet [By MUQWISHI]
🔑
🌐
✅
🏅
Financial Data Spreadsheet by MUQWISHI is a TradingView indicator displaying spreadsheet-like tables of key financial metrics from income statements to cash flow statements, based on most recent reporting period.
🤖
by iravan
Free
TradingView Indicator
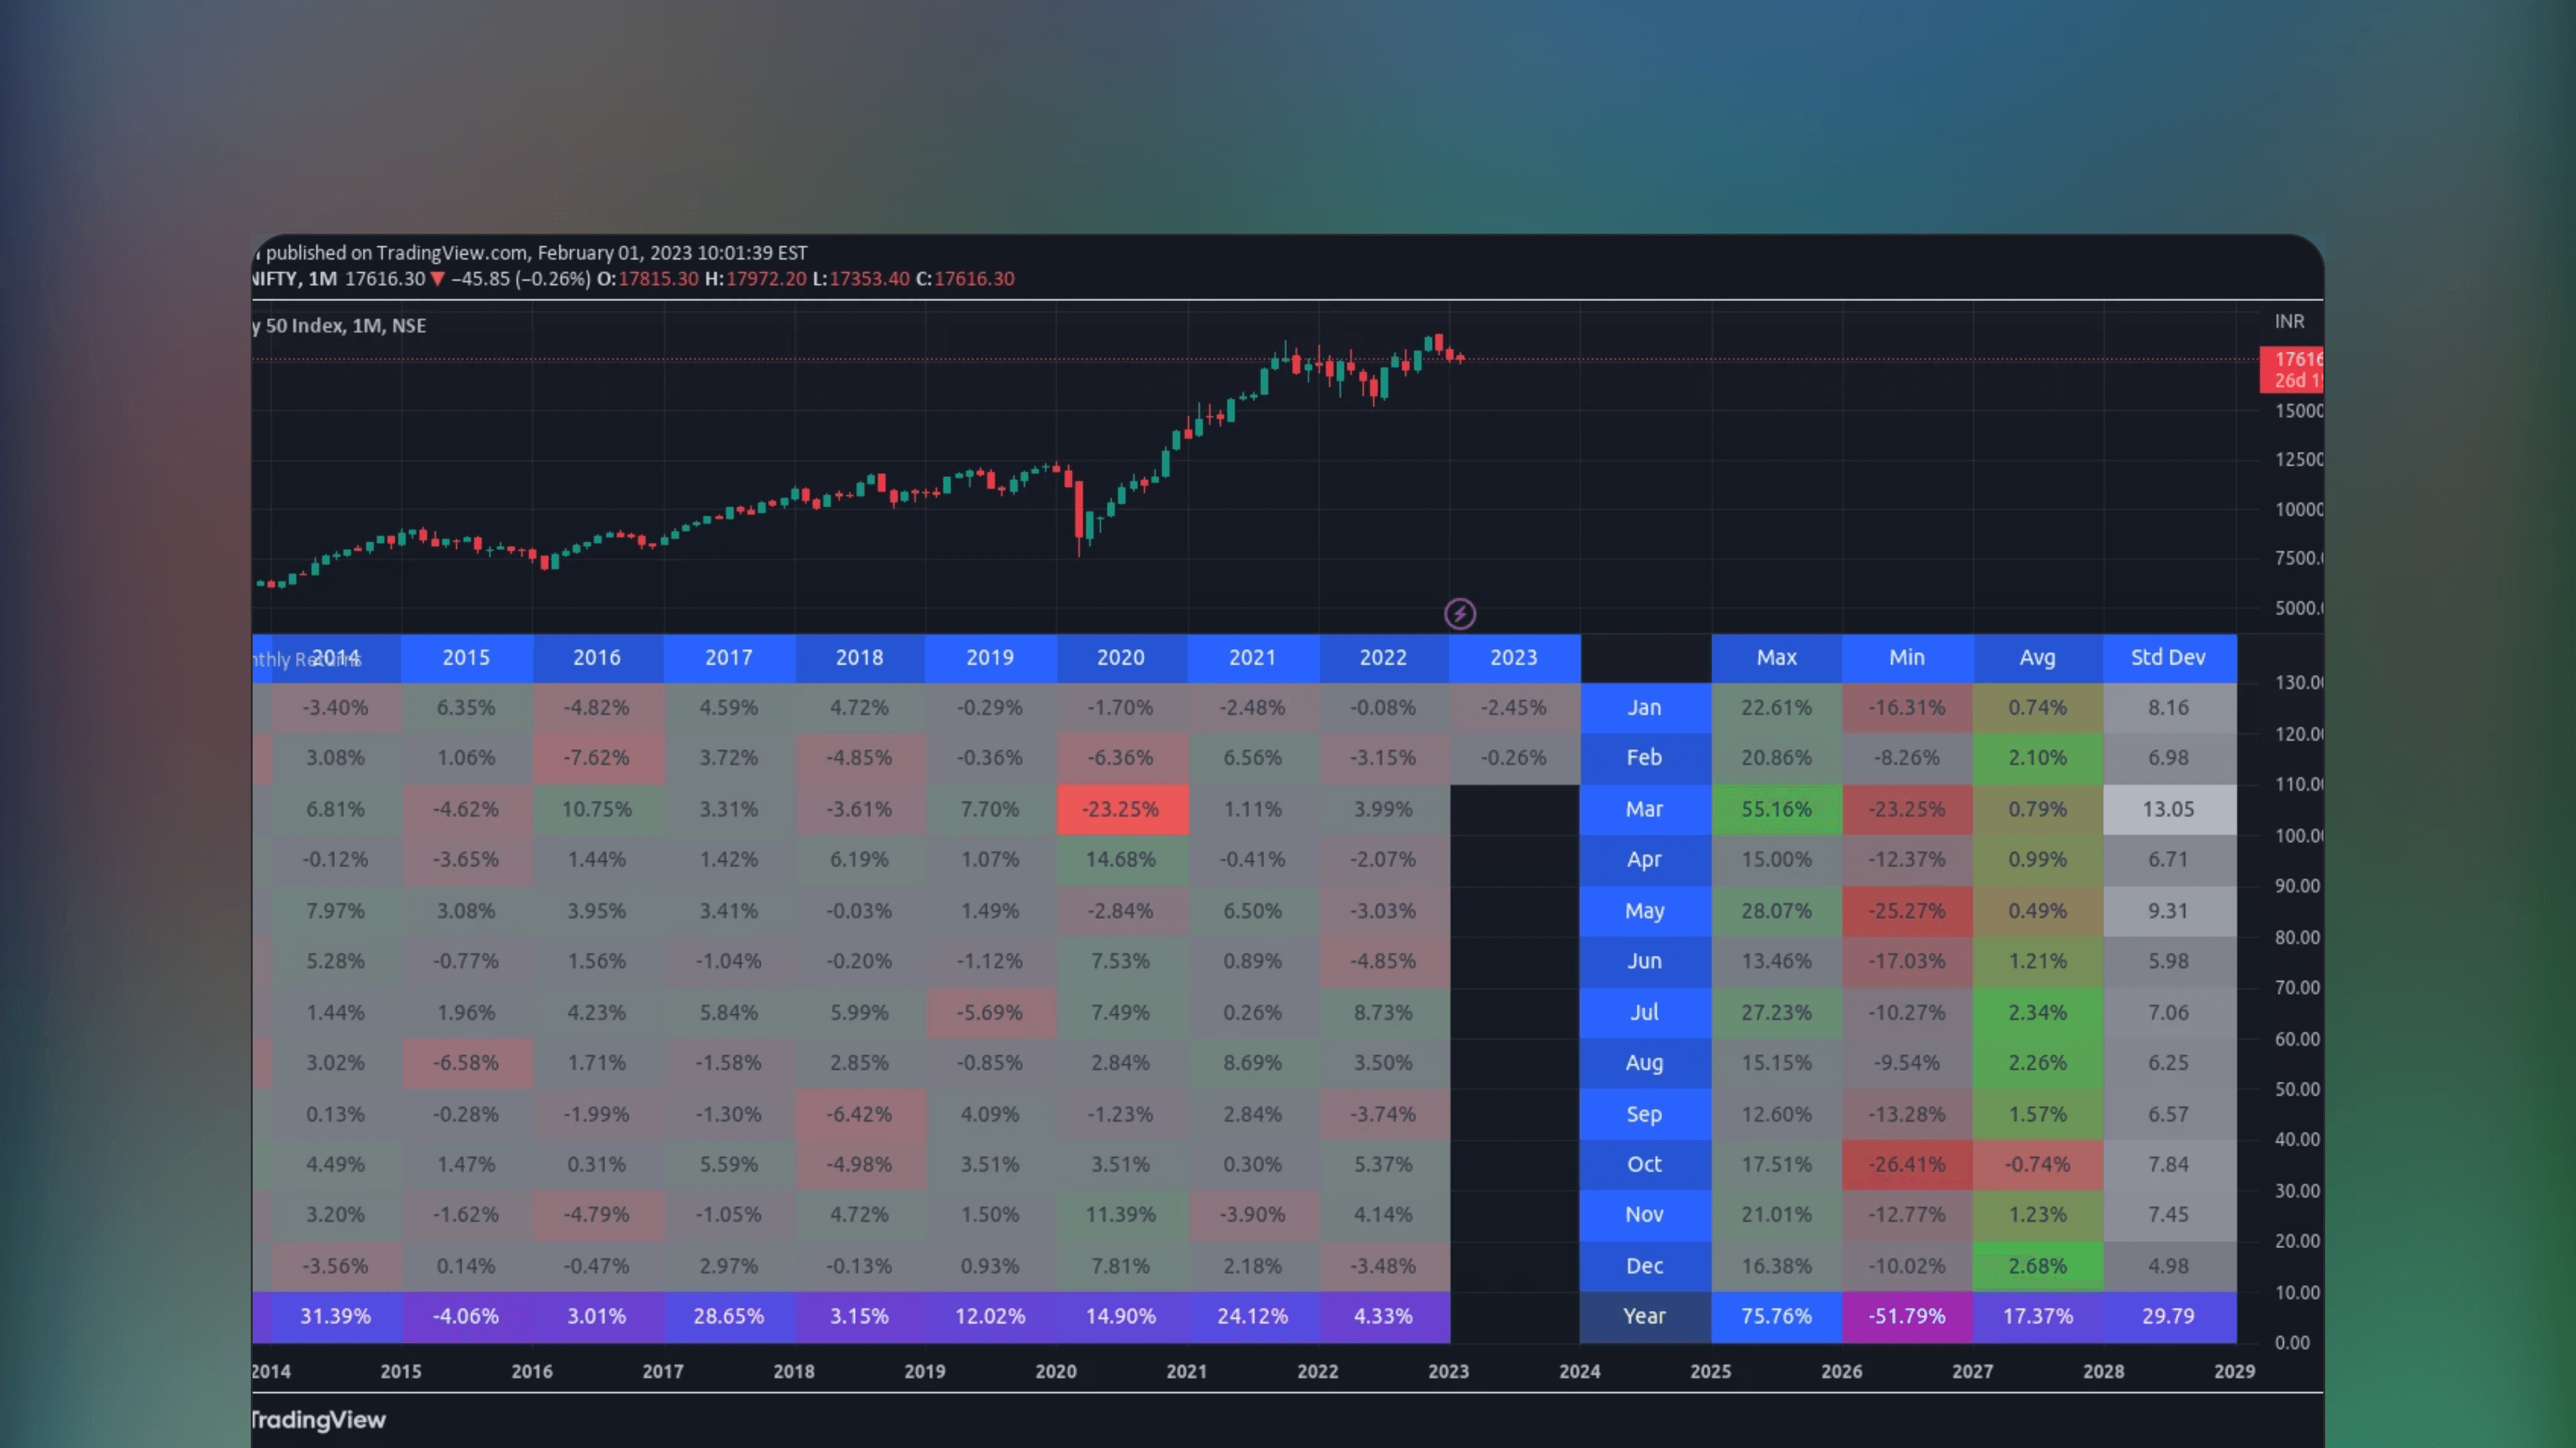
Monthly Returns
🔑
🌐
✅
🏅
Monthly Returns is a free TradingView indicator that displays monthly and yearly investment returns in a table, including maximum, minimum and average returns as well as standard deviations, providing a statistical summary of performance.
🤖
by Zeiierman
Free
TradingView Indicator
Dividend Calendar (Zeiierman)
🔑
🌐
✅
🏅
Dividend Calendar (Zeiierman) is a TradingView indicator that provides a schedule of expected dividend payouts from public companies.
🤖
by loxx
Free
TradingView Indicator
Black Scholes Option Pricing Model w/ Greeks [Loxx]
🔑
🌐
✅
🏅
Black Scholes Option Pricing Model w/ Greeks [Loxx] is a TradingView indicator that uses the Black Scholes Merton model to automatically calculate option Greeks, displayed in a user-friendly dashboard format.

🤖
by QuantNomad
Free
TradingView Indicator
Portfolio Performance
🔑
🌐
✅
Portfolio Performance is a free TradingView Indicator that computes your portfolio’s performance using various performance metrics and returns over different periods of time.
🤖
by theheirophant
Free
TradingView Indicator
Blockchain Fundamentals: 200 Week MA Heatmap [CR]
🔑
🏅
Blockchain Fundamentals: 200 Week MA Heatmap [CR] is a TradingView indicator that visually represents long-term cryptocurrency market trends using a 200-week moving average with heatmap style colors.
🤖
by theheirophant
Free
TradingView Indicator
Blockchain Fundamentals - Active Address Sentiment Osc. [CR]
🔑
🌐
🏅
Blockchain Fundamentals - Active Address Sentiment Osc. [CR] is a TradingView Indicator that analyzes daily active Bitcoin addresses on the BTC blockchain relative BTC’s daily returns to identify discrepancies in Bitcoin’s intrinsic value.
🤖
by Zeiierman
Free
TradingView Indicator
Breakout Probability (Expo)
🔑
🌐
🏅
Breakout Probability (Expo) is a TradingView indicator that calculates the likelihood of new market highs or lows, displaying statistical likelihood for price levels above and below current price.
🤖
by cryptoonchain
Free
TradingView Indicator
BTC Leading SOPR: Onchain
🔑
🌐
BTC Leading SOPR: Onchain is a free TradingView indicator that calculates the SOPR Moving Average on a weekly timeframe to estimate realized profit or loss from on-chain data.
🤖
by jdehorty
Free
TradingView Indicator
Machine Learning: Lorentzian Classification
🔑
✅
🏅
Machine Learning: Lorentzian Classification is an Indicator that uses the Lorentzian Distance Classifier machine learning algorithm to categorize historical price data for predicting future price movements.
🤖
by iravan
Free
TradingView Indicator
Equity Bond Currency Dashboard
🔑
🌐
✅
Equity Bond Currency Dashboard is a TradingView Indicator that visualizes demand-flow between equities, bonds and currencies across six countries, allowing track of institutional money flows and visuals for interconnected market dynamics.
🤖
by KioseffTrading
Free
TradingView Indicator
Fundamentals Graphing [Kioseff Trading]
🔑
✅
🏅
Fundamentals Graphing [Kioseff Trading] is a TradingView indicator that displays essential fundamental metrics for up to 40 stocks. It allows users to compare various key financial metrics like earnings and revenue for easy benchmarking.
🤖
by KioseffTrading
Free
TradingView Indicator
Monte Carlo Simulation - Your Strategy [Kioseff Trading]
🔑
🌐
✅
🏅
Monte Carlo Simulation - Your Strategy by Kioseff Trading is a free TradingView indicator that leverages Monte Carlo simulations to analyze the variability and potential outcomes of your inputted trading strategies or the assets displayed on your chart. Calculate your luck factor using this indicator.
🤖
by KioseffTrading
Free
TradingView Indicator
The Next Pivot [Kioseff Trading]
🔑
🌐
🏅
The Next Pivot [Kioseff Trading] is a TradingView indicator that employs similarity measures to compare historical price sequences with current data, formulating potential paths for future price action.
🤖
by KioseffTrading
Free
TradingView Indicator
(Quartile Vol.; Vol. Aggregation; Range US Bars; Gaps) [Kioseff]
🔑
🏅
The (Quartile Vol.; Vol. Aggregation; Range US Bars; Gaps) [Kioseff] Indicator is a TradingView tool that analyzes price action and volume by breaking volume into aggregated quartiles for noise filtered price and volume analysis.
🤖
by tradeforopp
Free
TradingView Indicator
Seasonality [TFO]
🔑
🌐
✅
🏅
Seasonality [TFO] is a TradingView indicator that analyzes an asset's average performance across daily, monthly, and quarterly timeframes. It uses a 252-trading day calendar, aggregating daily data into 21-day months and 63-day quarters for gauging seasonal trends.
🤖
by KioseffTrading
Free
TradingView Indicator
Crypto Terminal [Kioseff Trading]
🔑
🌐
🏅
Crypto Terminal [Kioseff Trading] is a TradingView indicator that uses on-chain data to provide real-time cryptocurrency statistics directly on your Tradingview charts.
🤖
by toodegrees
Free
TradingView Indicator
Seasonal Open Interest° by toodegrees
🔑
🌐
✅
🏅
Seasonal Open Interest° by toodegrees is a TradingView Indicator that displays the daily number of outstanding futures contracts for specific commodities and markets, based on Open Interest data released after each trading day.
🤖
by pAulseperformance
Free
TradingView Indicator
Portfolio Backtester Engine
🔑
🌐
✅
🏅
Portfolio Backtester Engine is a TradingView indicator that enables backtesting trading strategies across multiple symbols simultaneously. Adapted from PineCoders’ engine, it retains all key functionalities while offering simultaneous backtesting in one go.
🤖
by KioseffTrading
Free
TradingView Indicator
Portfolio Laboratory [Kioseff Trading]
🔑
✅
Portfolio Laboratory [Kioseff Trading] is a free TradingView Indicator that analyzes historical portfolio performance using weighted percentage changes and provides comparison to popular indices as well as various risk metrics.
🤖
by reees
Free
TradingView Indicator
Harmonic Pattern Detection, Prediction, and Backtesting Tool
🔑
🌐
The Harmonic Pattern Detection, Prediction, and Backtesting Tool is a free TradingView indicator that automatically identifies and predicts harmonic XABCD patterns and allows users to backtest signals generated by them.
🤖
by tradeforopp
Free
TradingView Indicator
Captain Backtest Model [TFO]
🔑
Captain Backtest Model [TFO] is a TradingView indicator created by @imjesstwoone and @mickey1984. It uses a systematic model to capture market expansions during the 10:00-14:00 EST 4-hour timeframe with three simple steps and adjustable settings based on the NQ 5m example.
🤖
by MUQWISHI
Free
TradingView Indicator
Annual Returns % Comparison [By MUQWISHI]
🔑
🌐
✅
🏅
Annual Returns % Comparison [By MUQWISHI] is a free TradingView indicator that benchmarks the historical annual percentage change between two symbols using a simple to understand column visualization.
🤖
by SegaRKO
Free
TradingView Indicator
Black-Scholes Options Pricing Model
🔑
🌐
✅
The Black-Scholes Options Pricing Model is a TradingView indicator that applies the Black-Scholes formula to determine the theoretical value of options. Features all important greeks, such as Delta, Gamma, Theta, Vanna and more.
🤖
by toodegrees
Free
TradingView Indicator
ICT Commitment of Traders° by toodegrees
🔑
🌐
✅
The ICT Commitment of Traders° by toodegrees is a TradingView indicator that analyzes weekly CFTC Commitment of Traders reports, displaying the long and short positions of three key market participants: commercial traders, large traders and small speculators.
🤖
by toodegrees
Free
TradingView Indicator
Interest Rate and GDP Dashboard by toodegrees
🔑
🌐
✅
🏅
Interest Rate and GDP Dashboard by toodegrees is a TradingView Indicator that aggregates interest rates and GDP data from major Central Banks into one view for timely nsights into key economic metrics.
🤖
by Steversteves
Free
TradingView Indicator
AR Forecast Scatterplot [SS]
🔑
✅
AR Forecast Scatterplot [SS] is a free TradingView Indicator that calculates and visualizes forecasted trends using statistical methods based on historical price data.
🤖
by ChartPrime
Free
TradingView Indicator
Risk Reward Optimiser [ChartPrime]
🔑
🌐
🏅
Risk Reward Optimiser [ChartPrime] is a TradingView Indicator that automates the optimization of risk-reward ratios using a variety of different benchmarks.
🤖
by roamin129
Free
TradingView Indicator
AMDX Time Zone
🔑
AMDX Time Zone is a TradingView indicator based on Accumulation and Manipulation theory, highlighting extreme price levels within specific time zones and trading sessions, also known as kill zones.
🤖
by jdehorty
Free
TradingView Indicator
Machine Learning: Lorentzian Classification
🔑
✅
🏅
Machine Learning: Lorentzian Classification is an Indicator that uses the Lorentzian Distance Classifier machine learning algorithm to categorize historical price data for predicting future price movements.
🤖
by iravan
Free
TradingView Indicator
Equity Bond Currency Dashboard
🔑
🌐
✅
Equity Bond Currency Dashboard is a TradingView Indicator that visualizes demand-flow between equities, bonds and currencies across six countries, allowing track of institutional money flows and visuals for interconnected market dynamics.
🤖
by KioseffTrading
Free
TradingView Indicator
Fundamentals Graphing [Kioseff Trading]
🔑
✅
🏅
Fundamentals Graphing [Kioseff Trading] is a TradingView indicator that displays essential fundamental metrics for up to 40 stocks. It allows users to compare various key financial metrics like earnings and revenue for easy benchmarking.
🤖
by KioseffTrading
Free
TradingView Indicator
Monte Carlo Simulation - Your Strategy [Kioseff Trading]
🔑
🌐
✅
🏅
Monte Carlo Simulation - Your Strategy by Kioseff Trading is a free TradingView indicator that leverages Monte Carlo simulations to analyze the variability and potential outcomes of your inputted trading strategies or the assets displayed on your chart. Calculate your luck factor using this indicator.
🤖
by KioseffTrading
Free
TradingView Indicator
The Next Pivot [Kioseff Trading]
🔑
🌐
🏅
The Next Pivot [Kioseff Trading] is a TradingView indicator that employs similarity measures to compare historical price sequences with current data, formulating potential paths for future price action.
🤖
by KioseffTrading
Free
TradingView Indicator
(Quartile Vol.; Vol. Aggregation; Range US Bars; Gaps) [Kioseff]
🔑
🏅
The (Quartile Vol.; Vol. Aggregation; Range US Bars; Gaps) [Kioseff] Indicator is a TradingView tool that analyzes price action and volume by breaking volume into aggregated quartiles for noise filtered price and volume analysis.
🤖
by tradeforopp
Free
TradingView Indicator
Seasonality [TFO]
🔑
🌐
✅
🏅
Seasonality [TFO] is a TradingView indicator that analyzes an asset's average performance across daily, monthly, and quarterly timeframes. It uses a 252-trading day calendar, aggregating daily data into 21-day months and 63-day quarters for gauging seasonal trends.
🤖
by KioseffTrading
Free
TradingView Indicator
Crypto Terminal [Kioseff Trading]
🔑
🌐
🏅
Crypto Terminal [Kioseff Trading] is a TradingView indicator that uses on-chain data to provide real-time cryptocurrency statistics directly on your Tradingview charts.
🤖
by toodegrees
Free
TradingView Indicator
Seasonal Open Interest° by toodegrees
🔑
🌐
✅
🏅
Seasonal Open Interest° by toodegrees is a TradingView Indicator that displays the daily number of outstanding futures contracts for specific commodities and markets, based on Open Interest data released after each trading day.
🤖
by pAulseperformance
Free
TradingView Indicator
Portfolio Backtester Engine
🔑
🌐
✅
🏅
Portfolio Backtester Engine is a TradingView indicator that enables backtesting trading strategies across multiple symbols simultaneously. Adapted from PineCoders’ engine, it retains all key functionalities while offering simultaneous backtesting in one go.
Discover trading edge
Discover trading edge
Indicators, Platforms & Education
Indicators, Platforms & Education
TradersList
Discover trading edge
Join Telegram
Weekly listings
Join Telegram
Disclaimer
Our goal is to achieve greater transparency, guidance and safety in trading and investing by providing means to discover, research and discuss trading/investing related sites/services.
Content provided on this site is not financial advice, meant for educational purposes only. TradersList does not endorse or guarantee any result for listed sites/services. Do your own research.
Read full disclaimer
TradersList
Discover trading edge
Join Telegram
Disclaimer
Our goal is to achieve greater transparency, guidance and safety in trading and investing by providing means to discover, research and discuss trading/investing related sites/services.
Content provided on this site is not financial advice, meant for educational purposes only. TradersList does not endorse or guarantee any result for listed sites/services. Do your own research.
Read full disclaimer