

From TradersList Editors
From TradersList Editors
Identify key liquidity zones and anticipate market maker moves with this TradingView indicator to improve your trading decisions.
Identify key liquidity zones and anticipate market maker moves with this TradingView indicator to improve your trading decisions.


TradingView Indicator
TradingView Indicator
Liquidity Raids & Stop Hunts with this Free TradingView indicator
Liquidity Raids & Stop Hunts with this Free TradingView indicator
by geneclash on TradingView
by geneclash on TradingView
by geneclash on TradingView
🤖
Liquidity Raid - Stop Hunt
Liquidity Raid - Stop Hunt
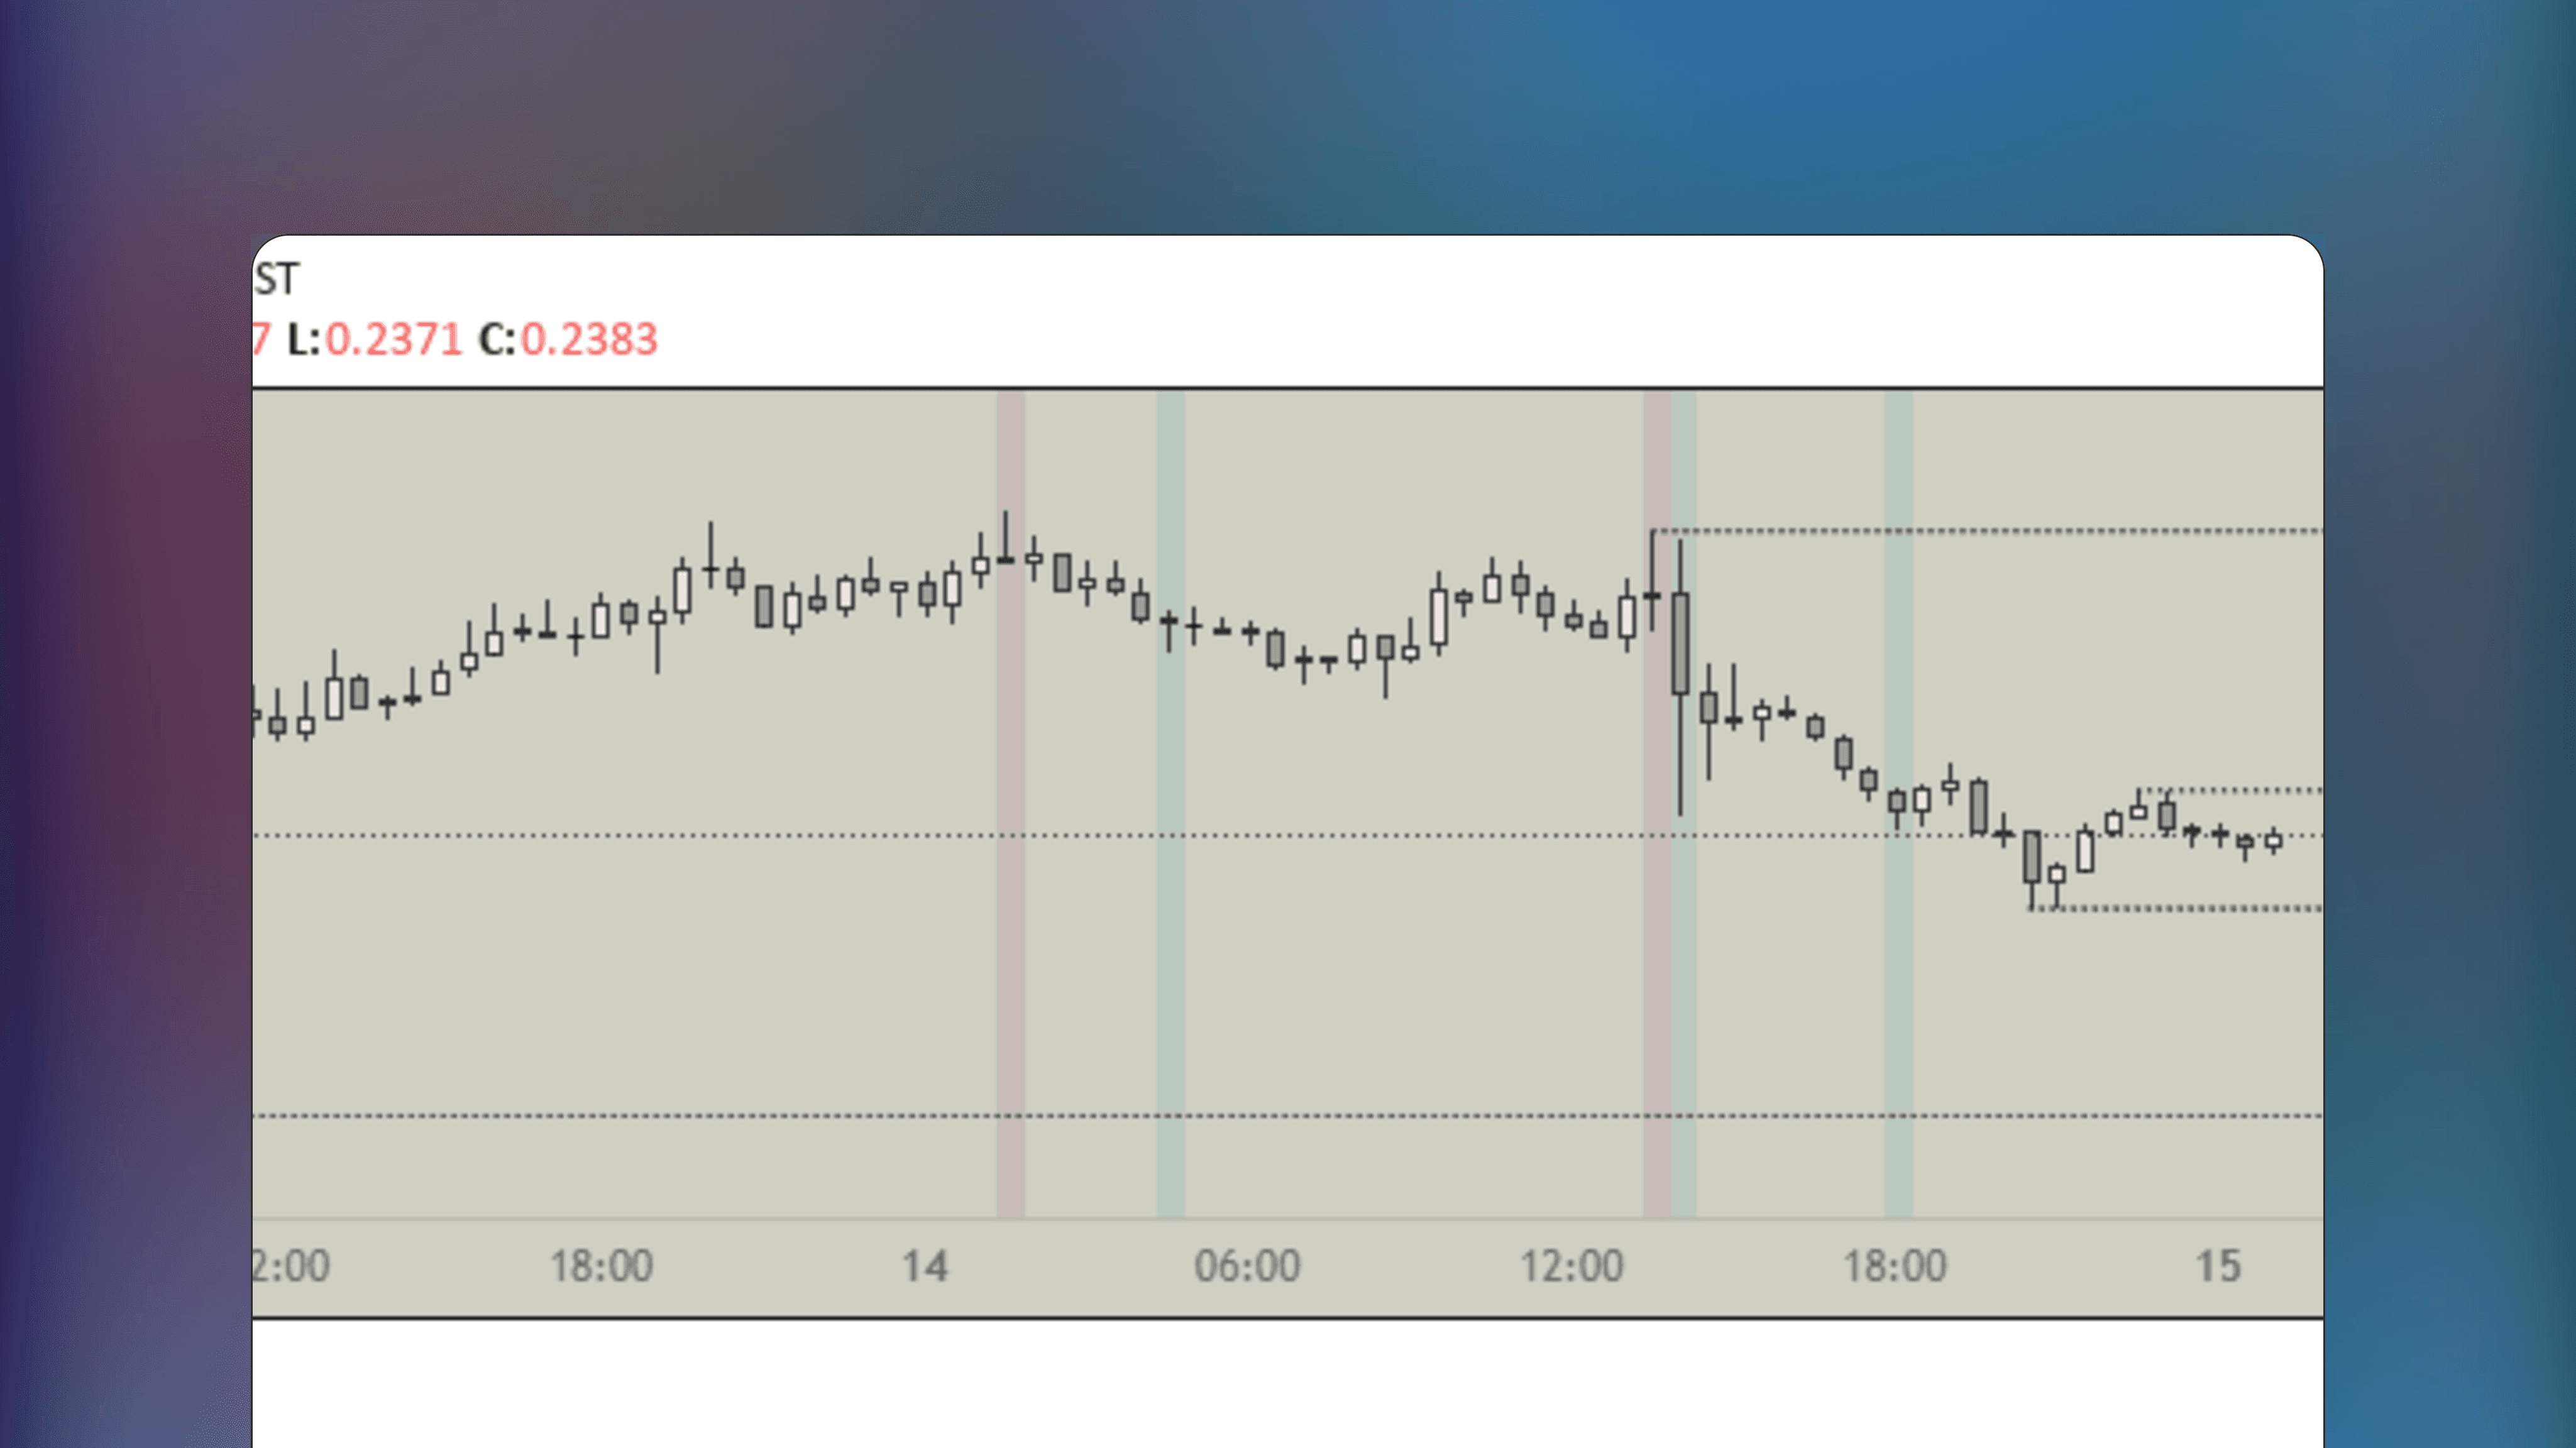
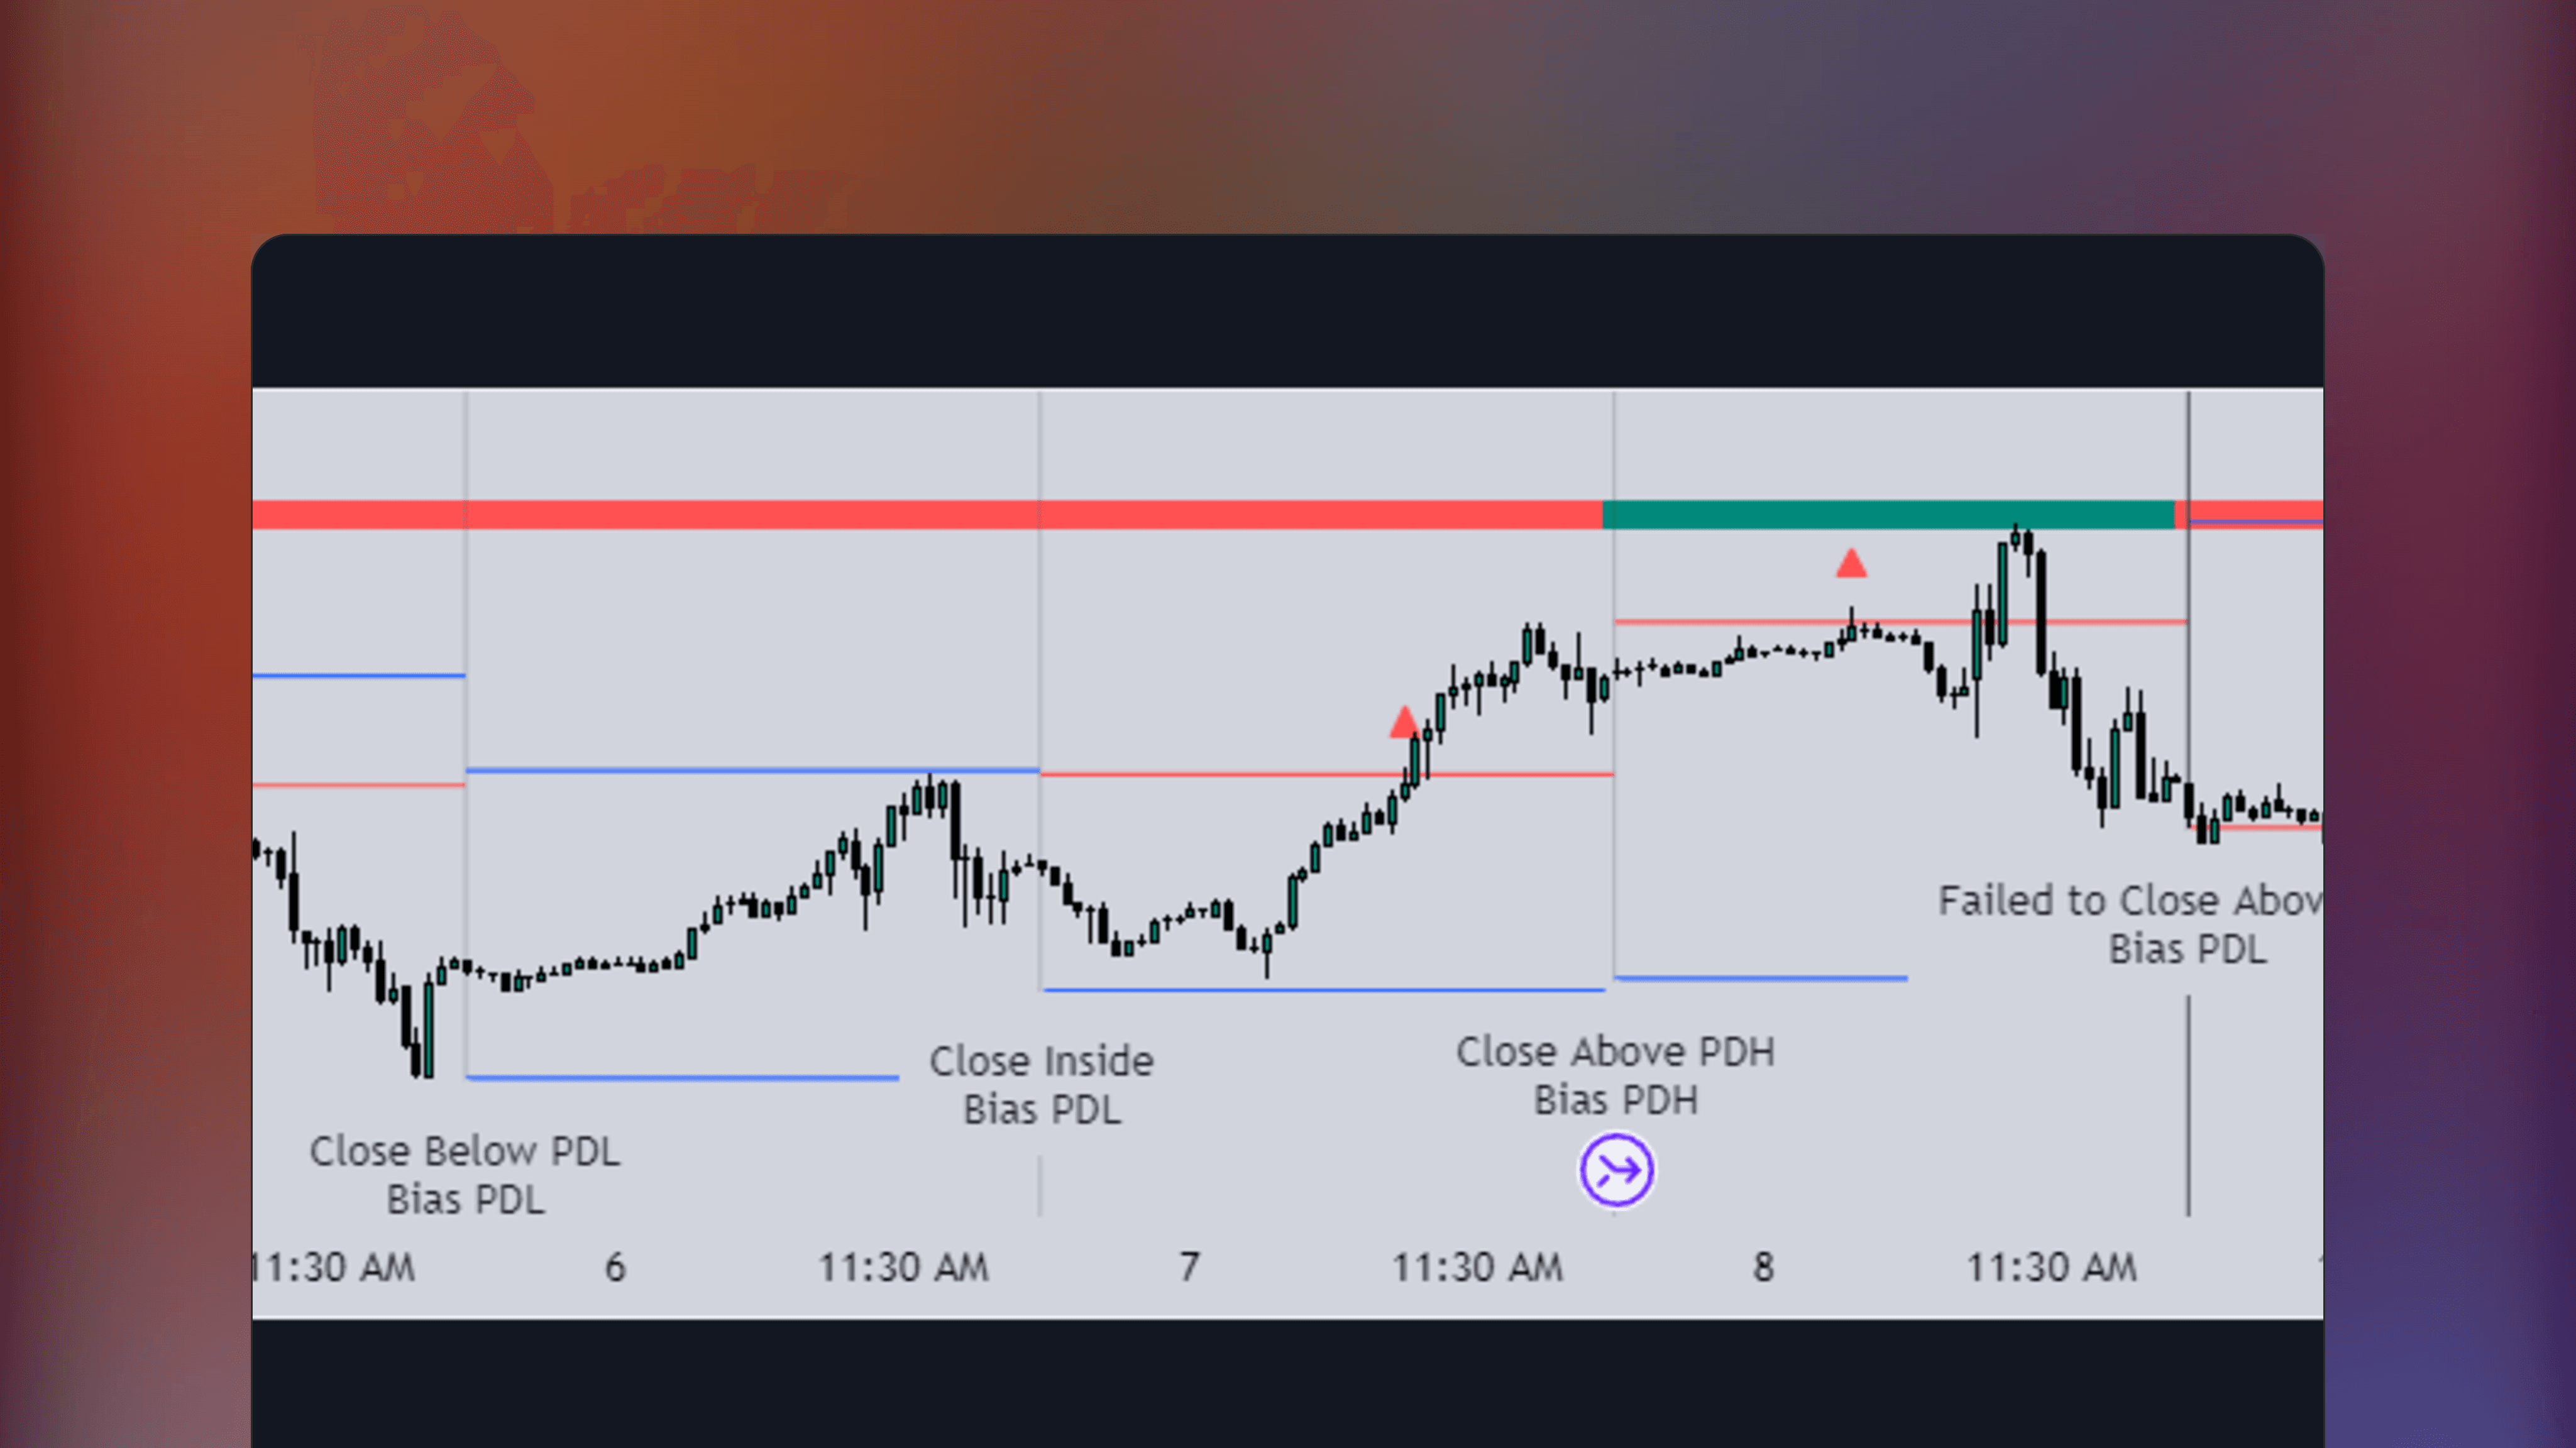
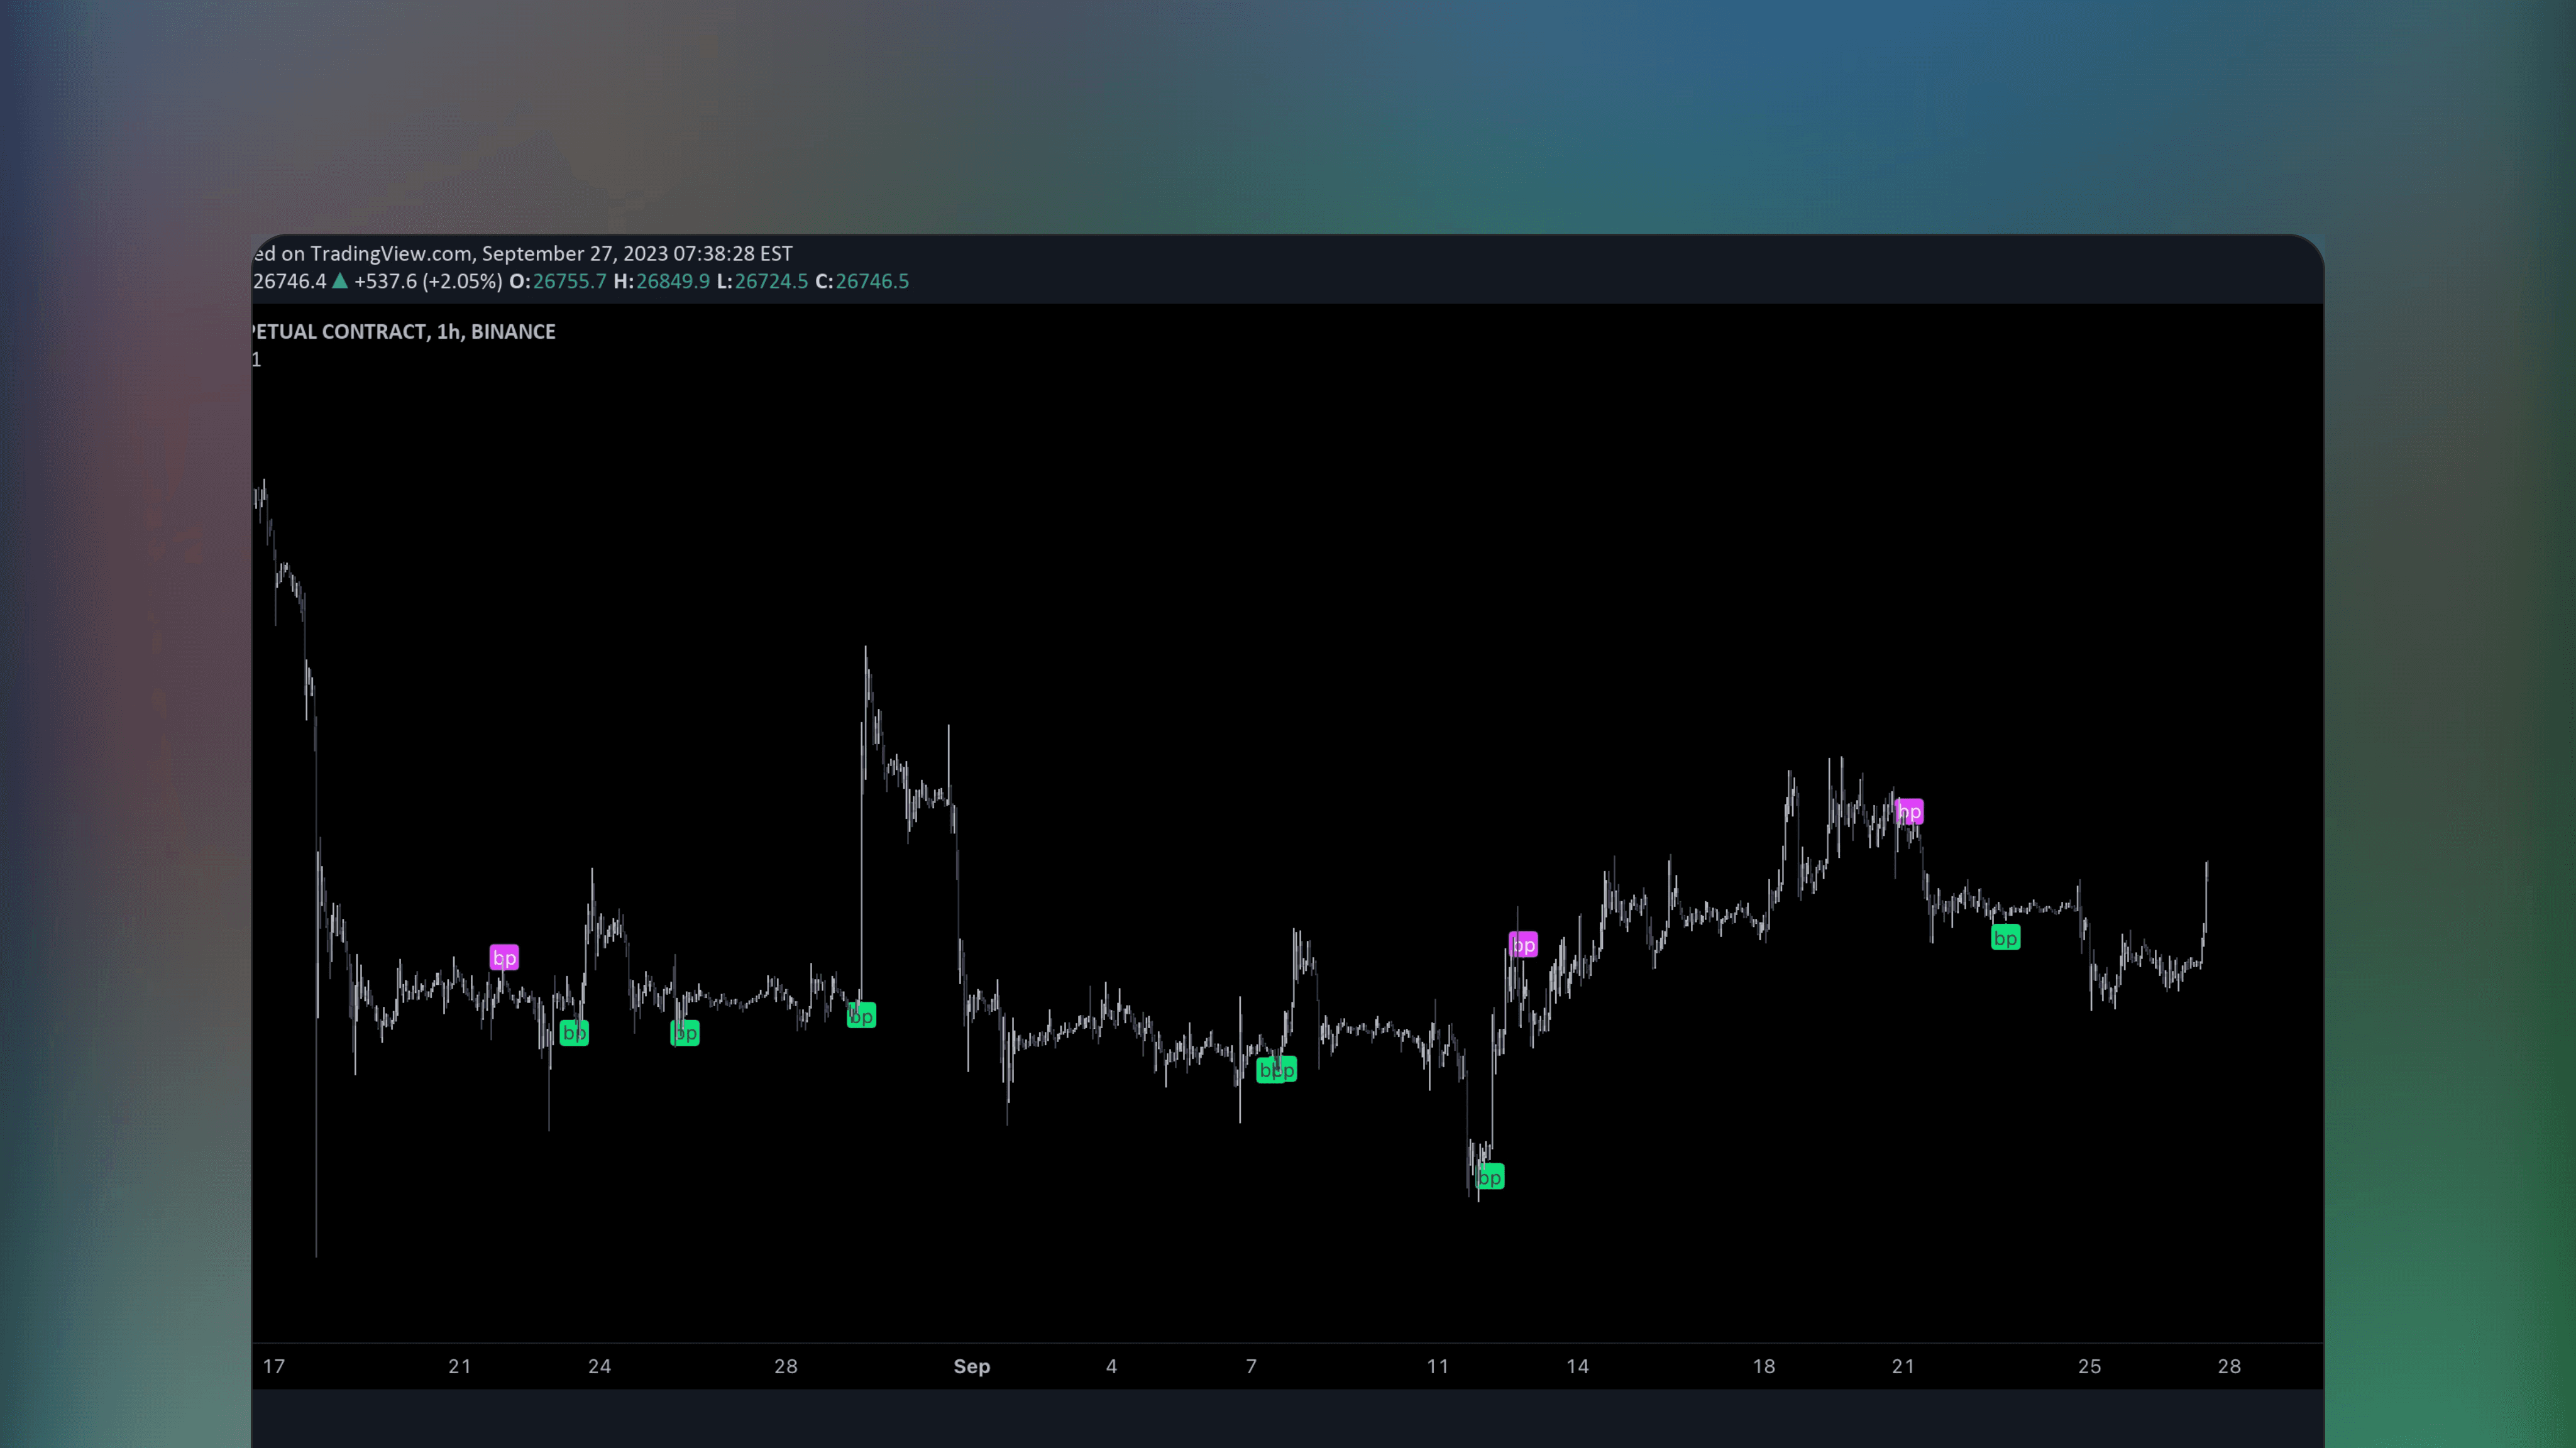
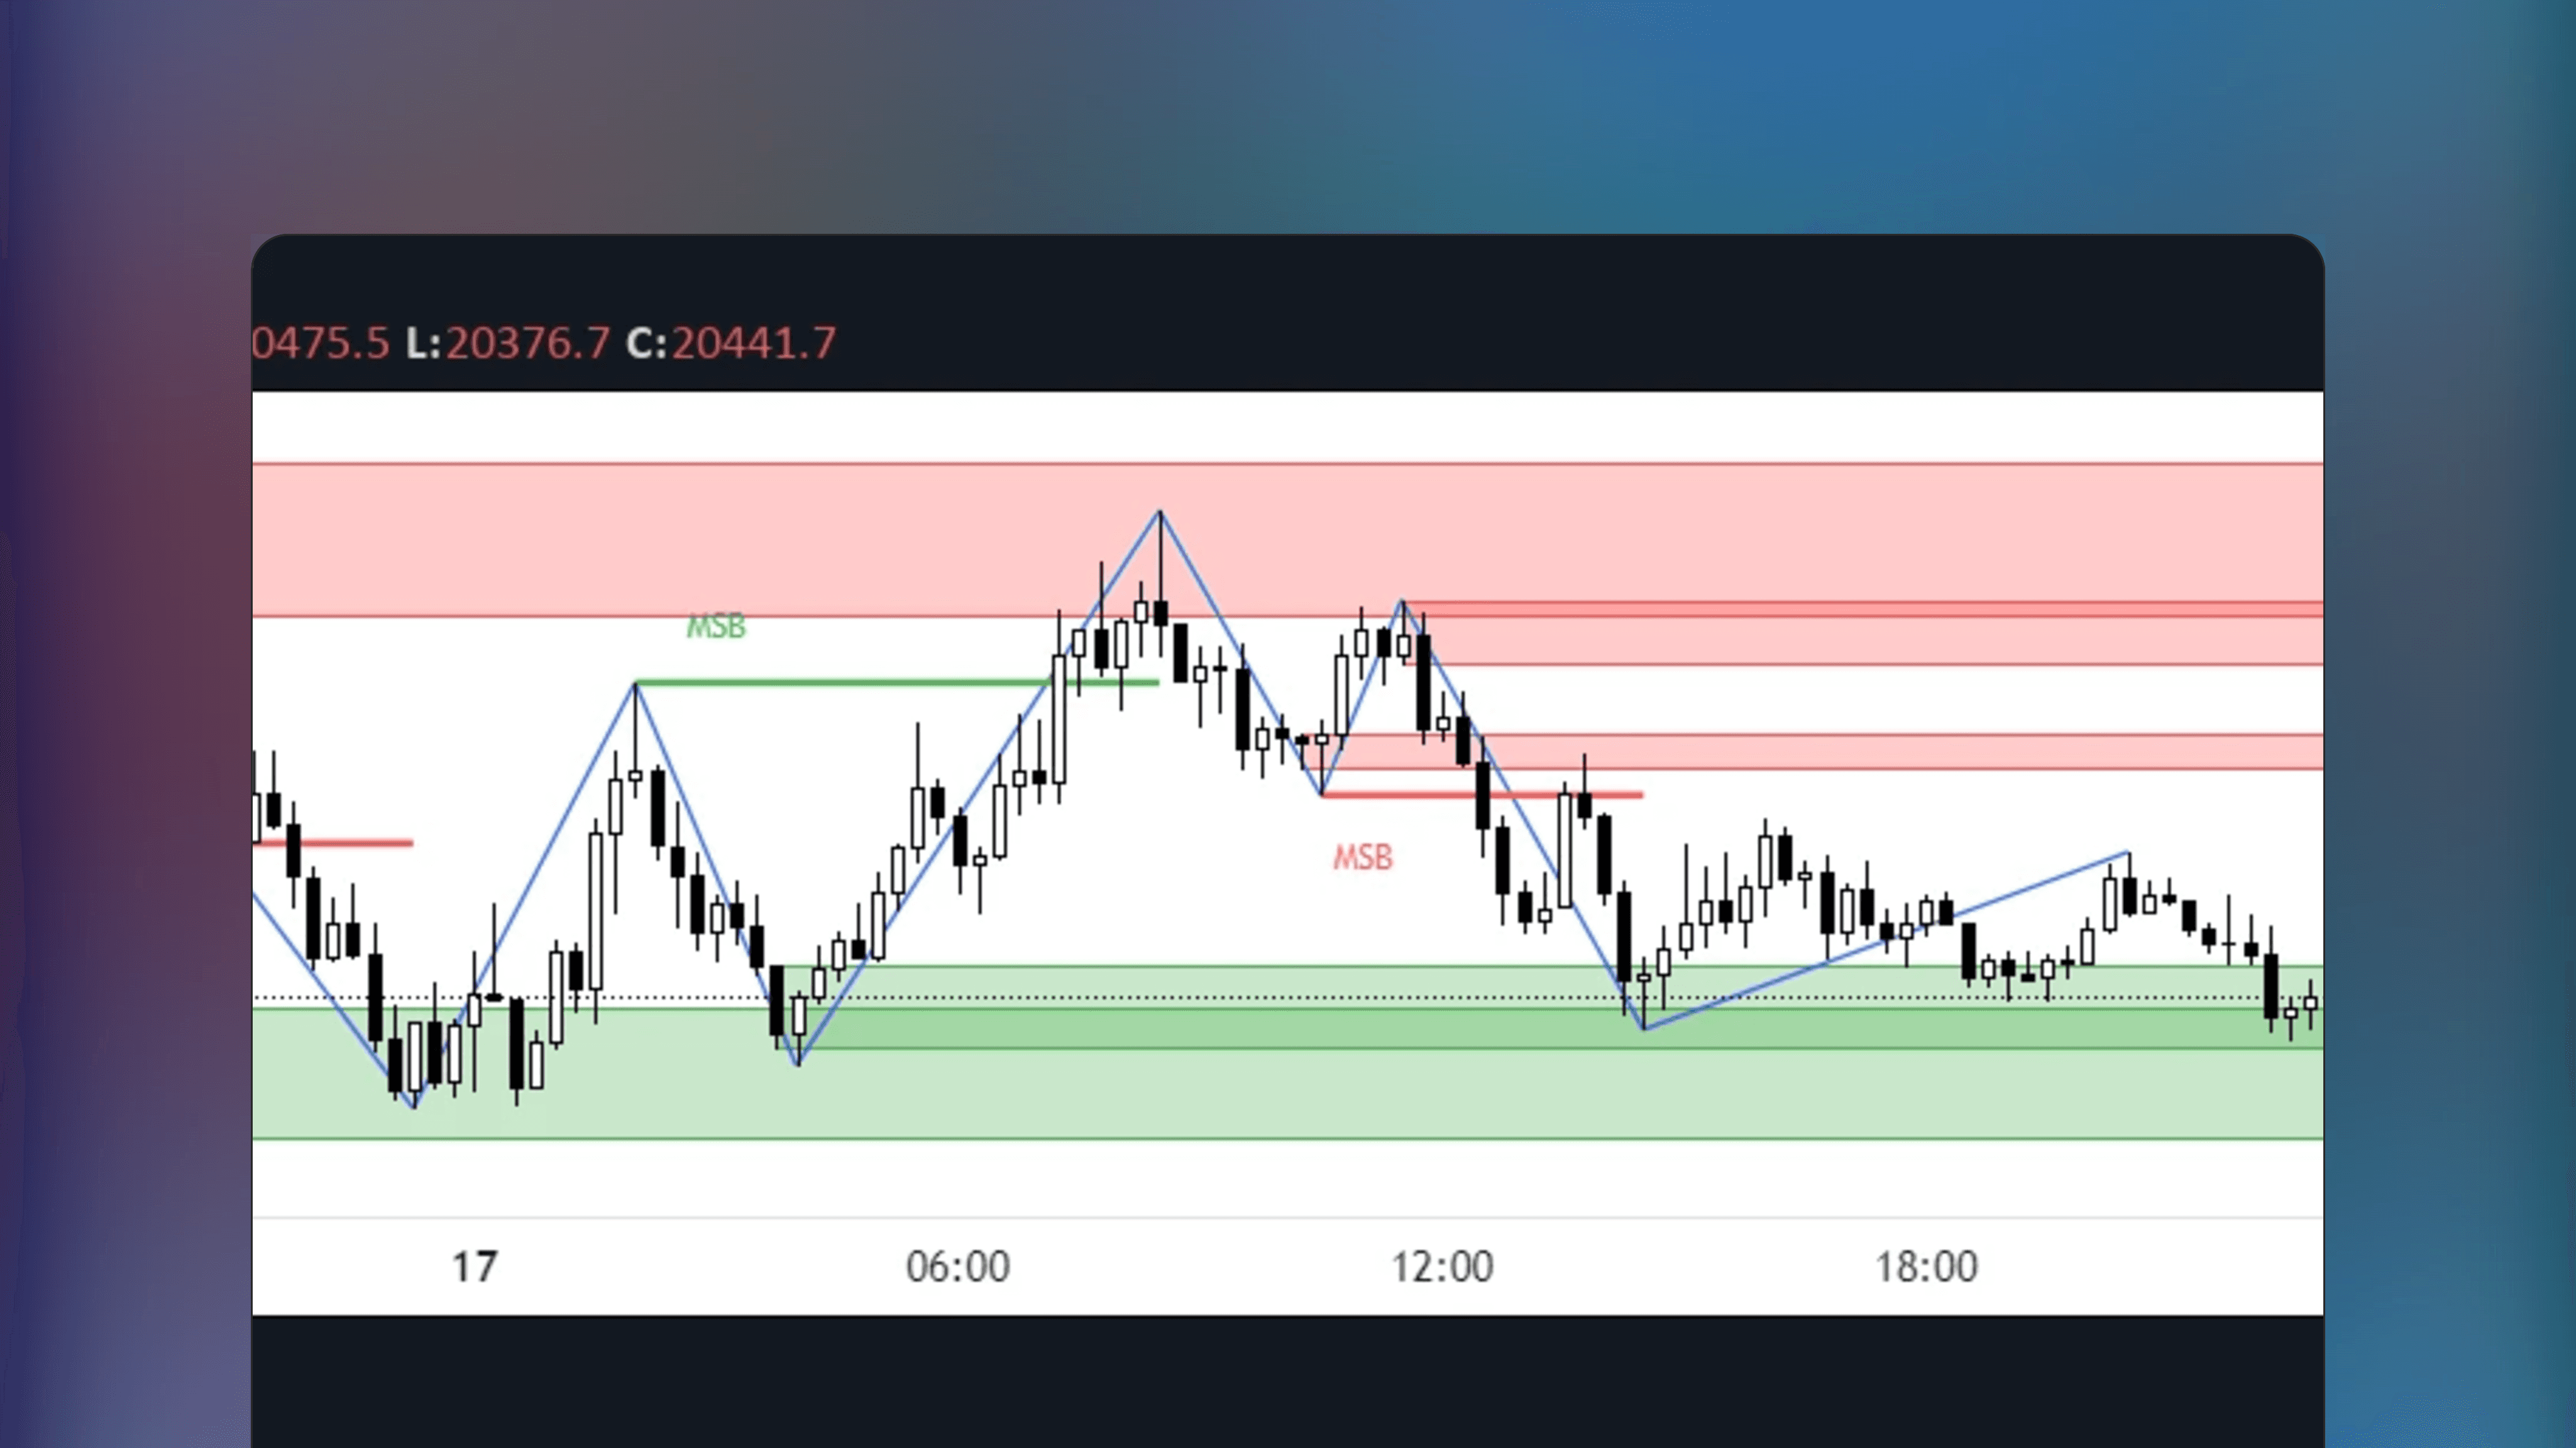
Liquidity Raid - Stop Hunt is a TradingView indicator that identifies liquidity areas above previous highs and below previous lows, where market makers may target stop orders.
Liquidity Raid - Stop Hunt is a TradingView indicator that identifies liquidity areas above previous highs and below previous lows, where market makers may target stop orders.
Get on TradingView
This indicator is available on TradingView web charting platform. Signing up for a free account is required, no downloads.
Get on TradingView
This indicator is available on TradingView web charting platform. Signing up for a free account is required, no downloads.
🔑
Open Source
Listing has publically available source code that can be audited and modified as needed.
🔑
Open Source
Listing has publically available source code that can be audited and modified as needed.
💸
Free Access
All features of this listing are fully free to use with no pricing tiers. Simply start using.
💸
Free Access
All features of this listing are fully free to use with no pricing tiers. Simply start using.
🥇
Trusted Publisher
Publisher of this listing is well recognized in social channels and receives overwhelmingly positive feedback.
🥇
Trusted Publisher
Publisher of this listing is well recognized in social channels and receives overwhelmingly positive feedback.
✅
Robust Theory
Concepts and theories mentioned in listing are based on generally approved and well established notions.
✅
Robust Theory
Concepts and theories mentioned in listing are based on generally approved and well established notions.
🌐
Popular Topic
Concepts and theories mentioned in listing are popular topics in web search
🌐
Popular Topic
Concepts and theories mentioned in listing are popular topics in web search
Published by geneclash on TradingView
Published by geneclash on TradingView
Featured Dec 6, 2024
Featured Dec 6, 2024
Liquidity sweeps automated
Liquidity sweeps automated
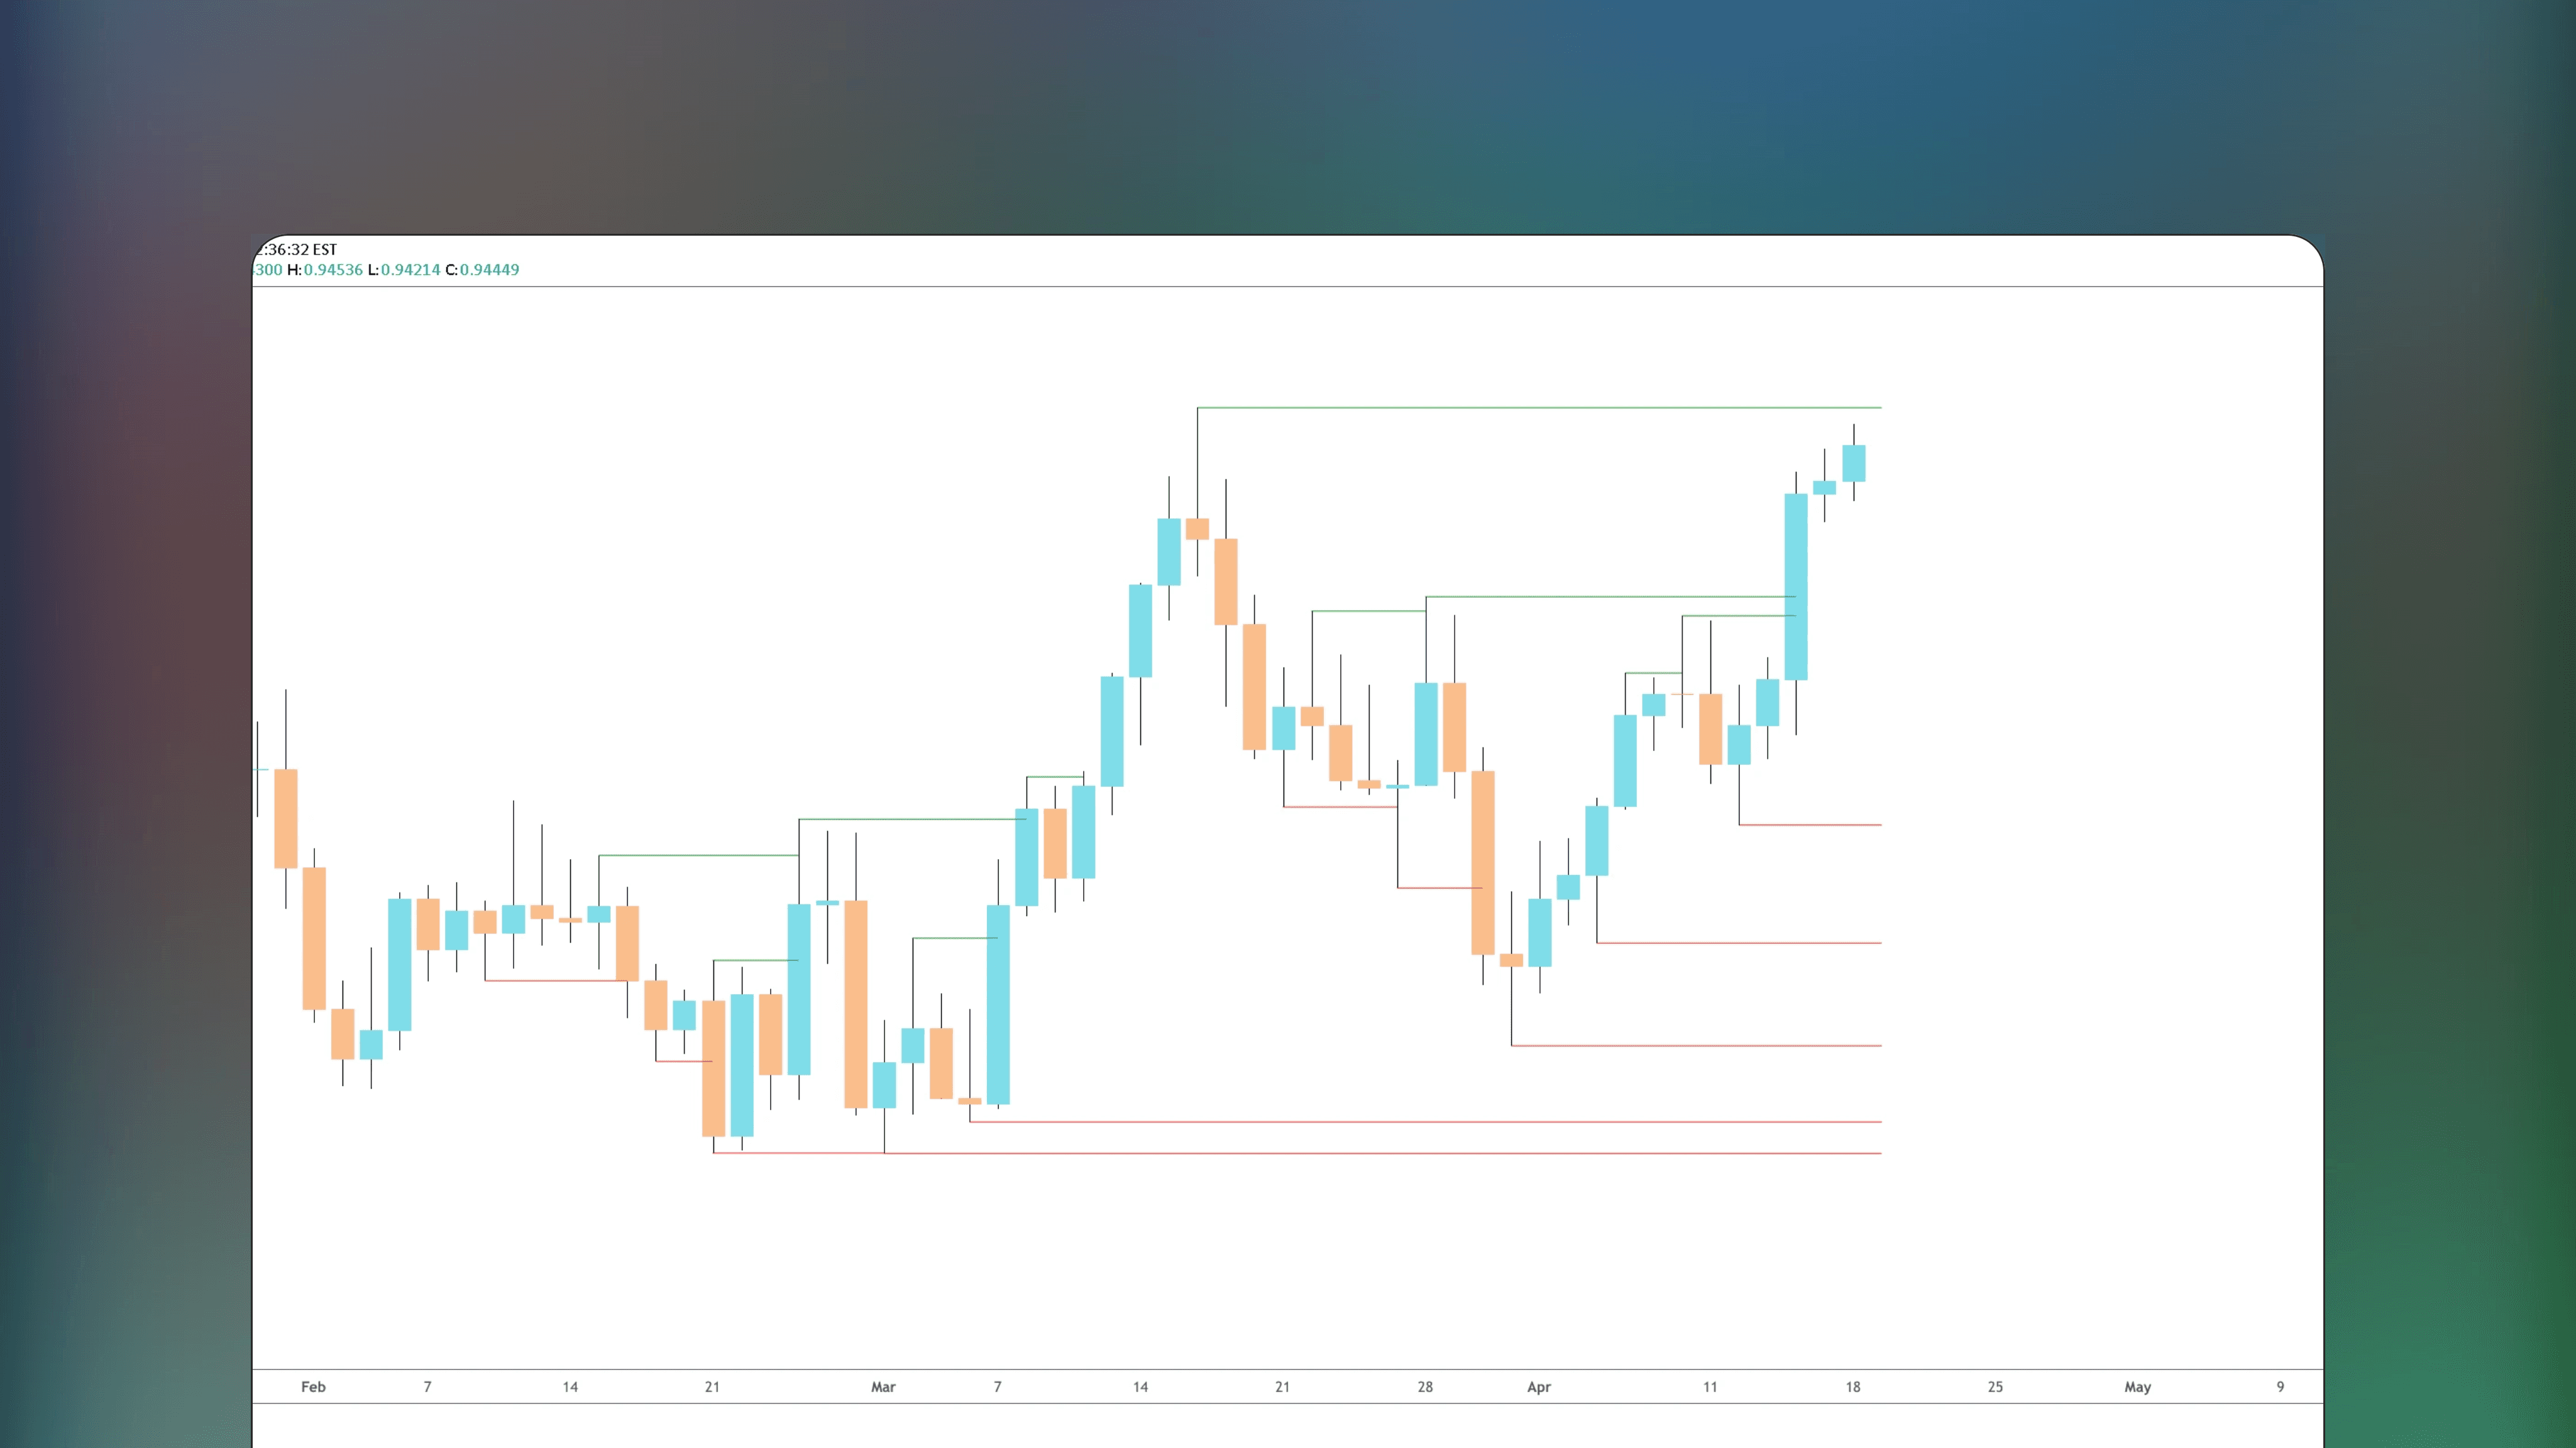
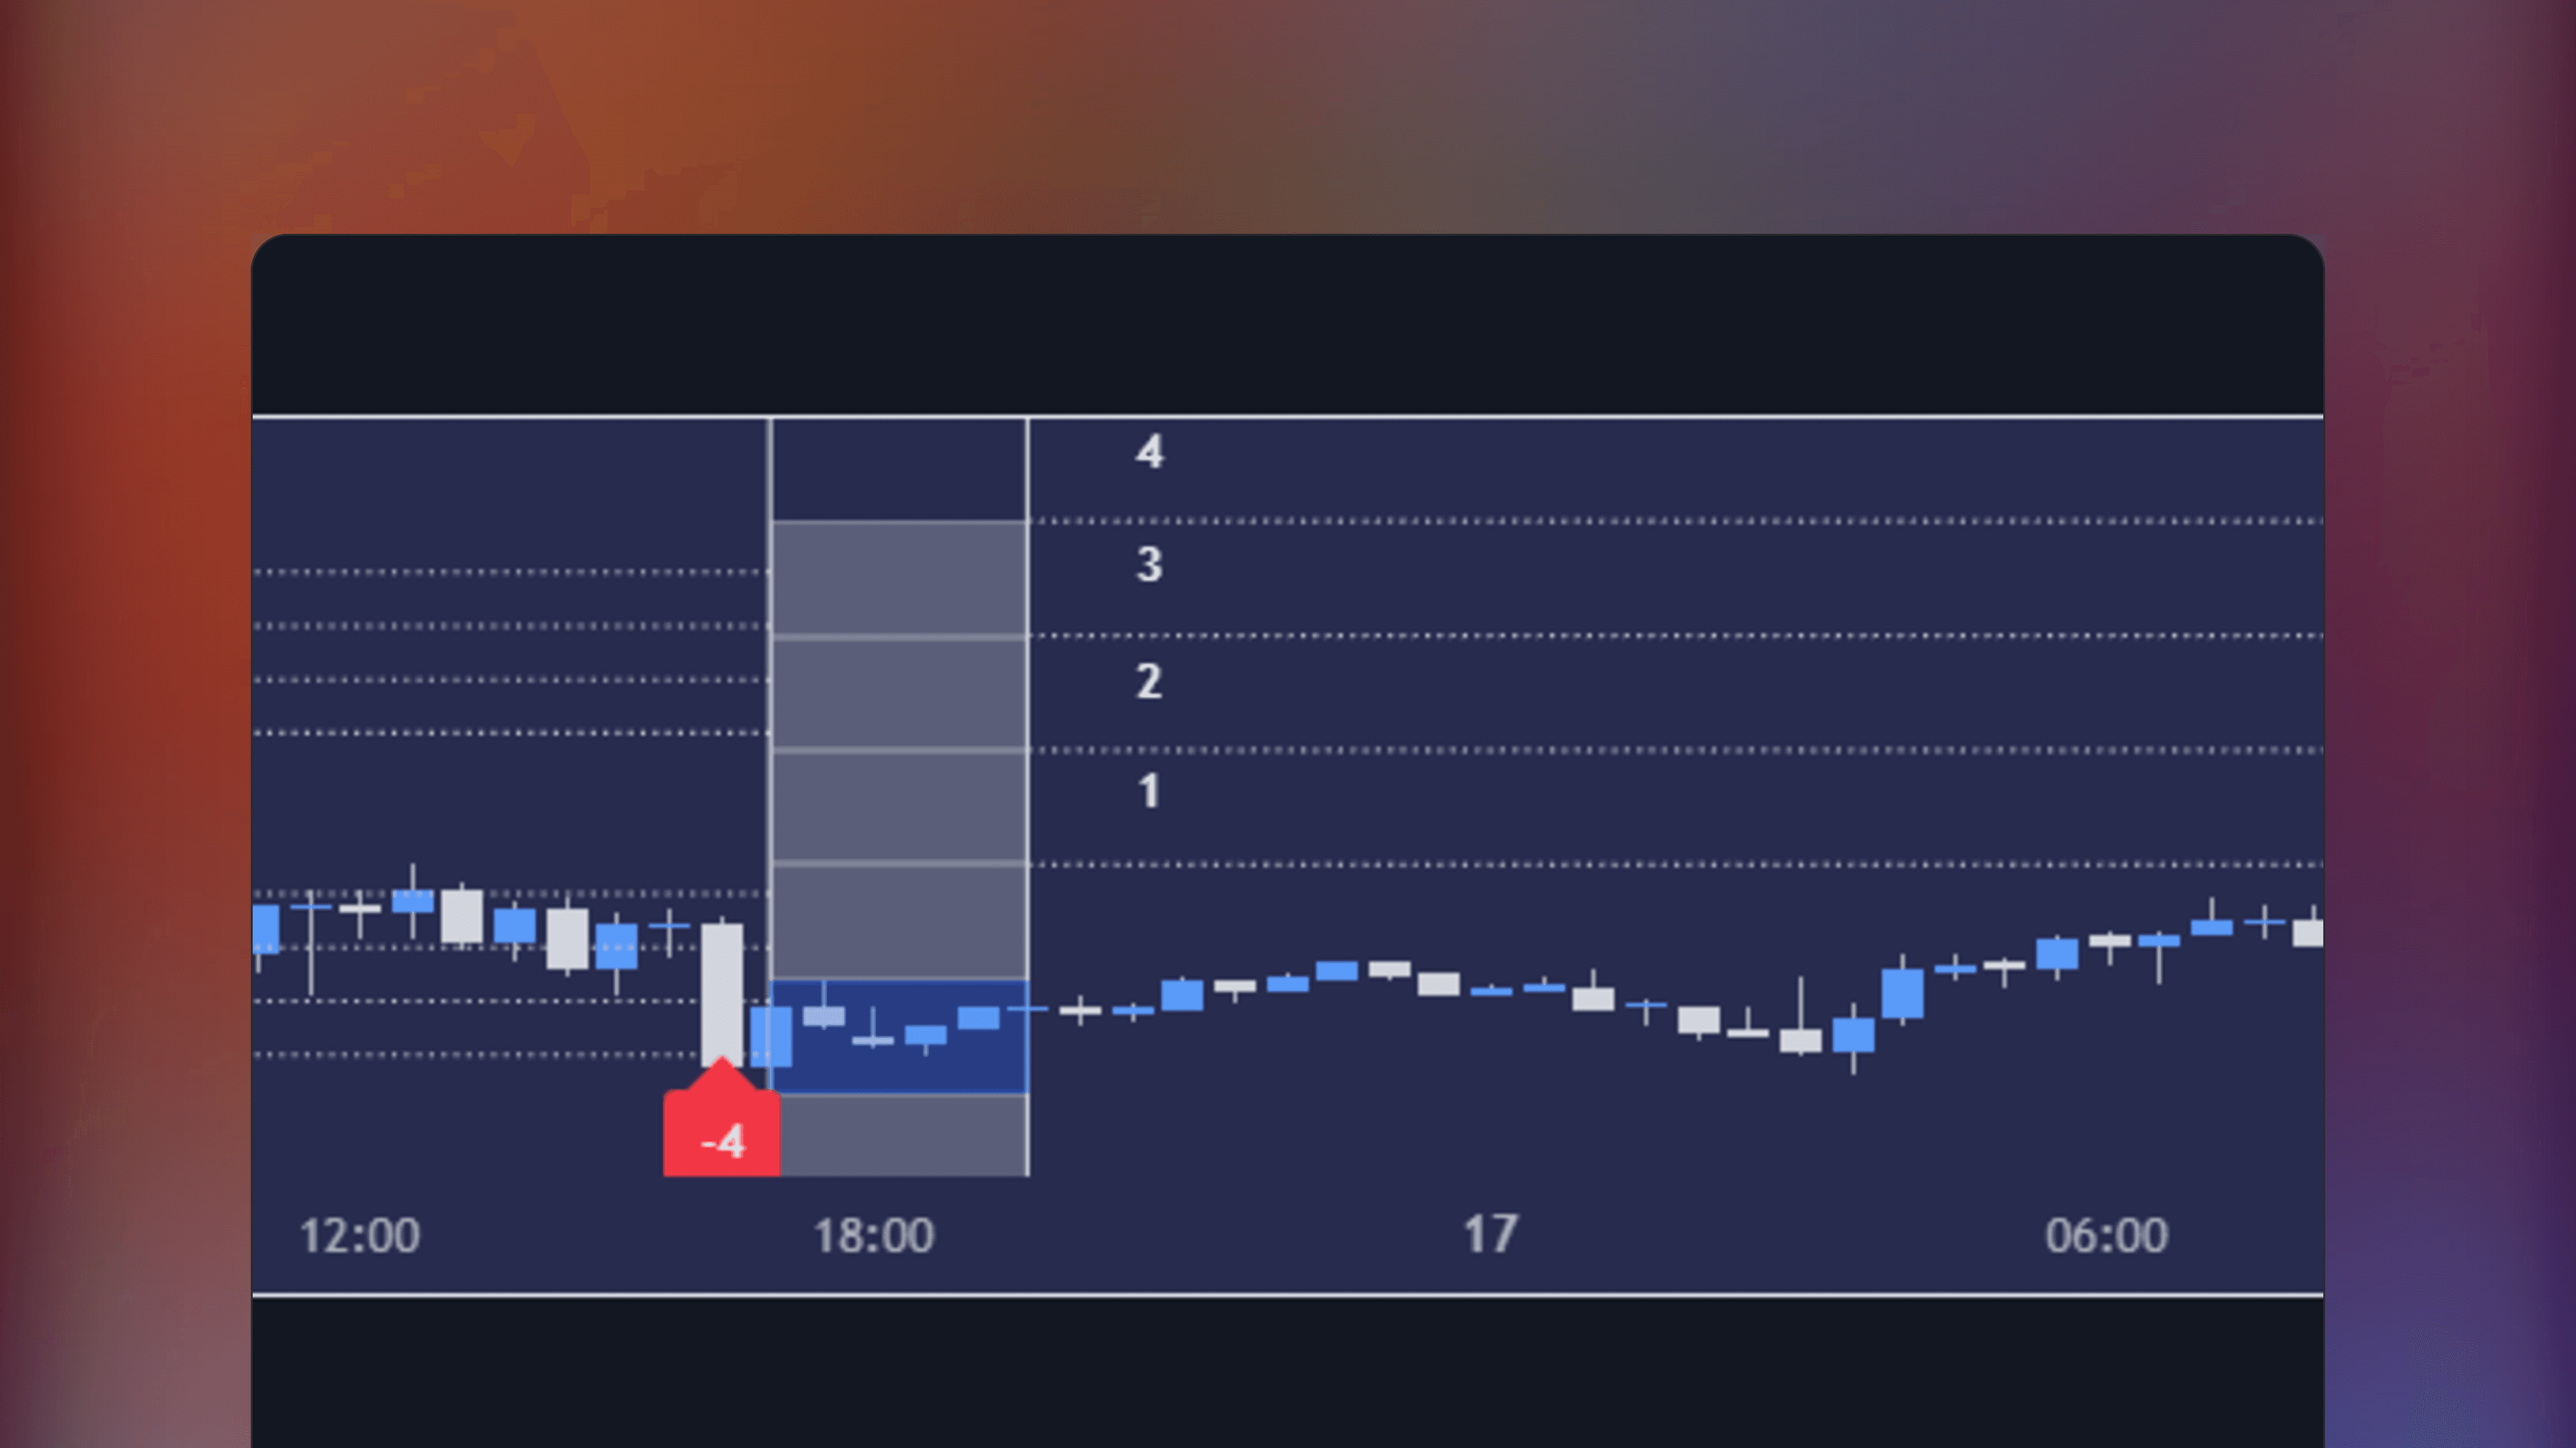
This TradingView Indicator identifies liquidity above previous highs and lows where market makers may target stop orders. Let's take a look at some ways you can incorporate Liquidity Raid - Stop Hunt into your market strategies.
This TradingView Indicator identifies liquidity above previous highs and lows where market makers may target stop orders. Let's take a look at some ways you can incorporate Liquidity Raid - Stop Hunt into your market strategies.
1
1
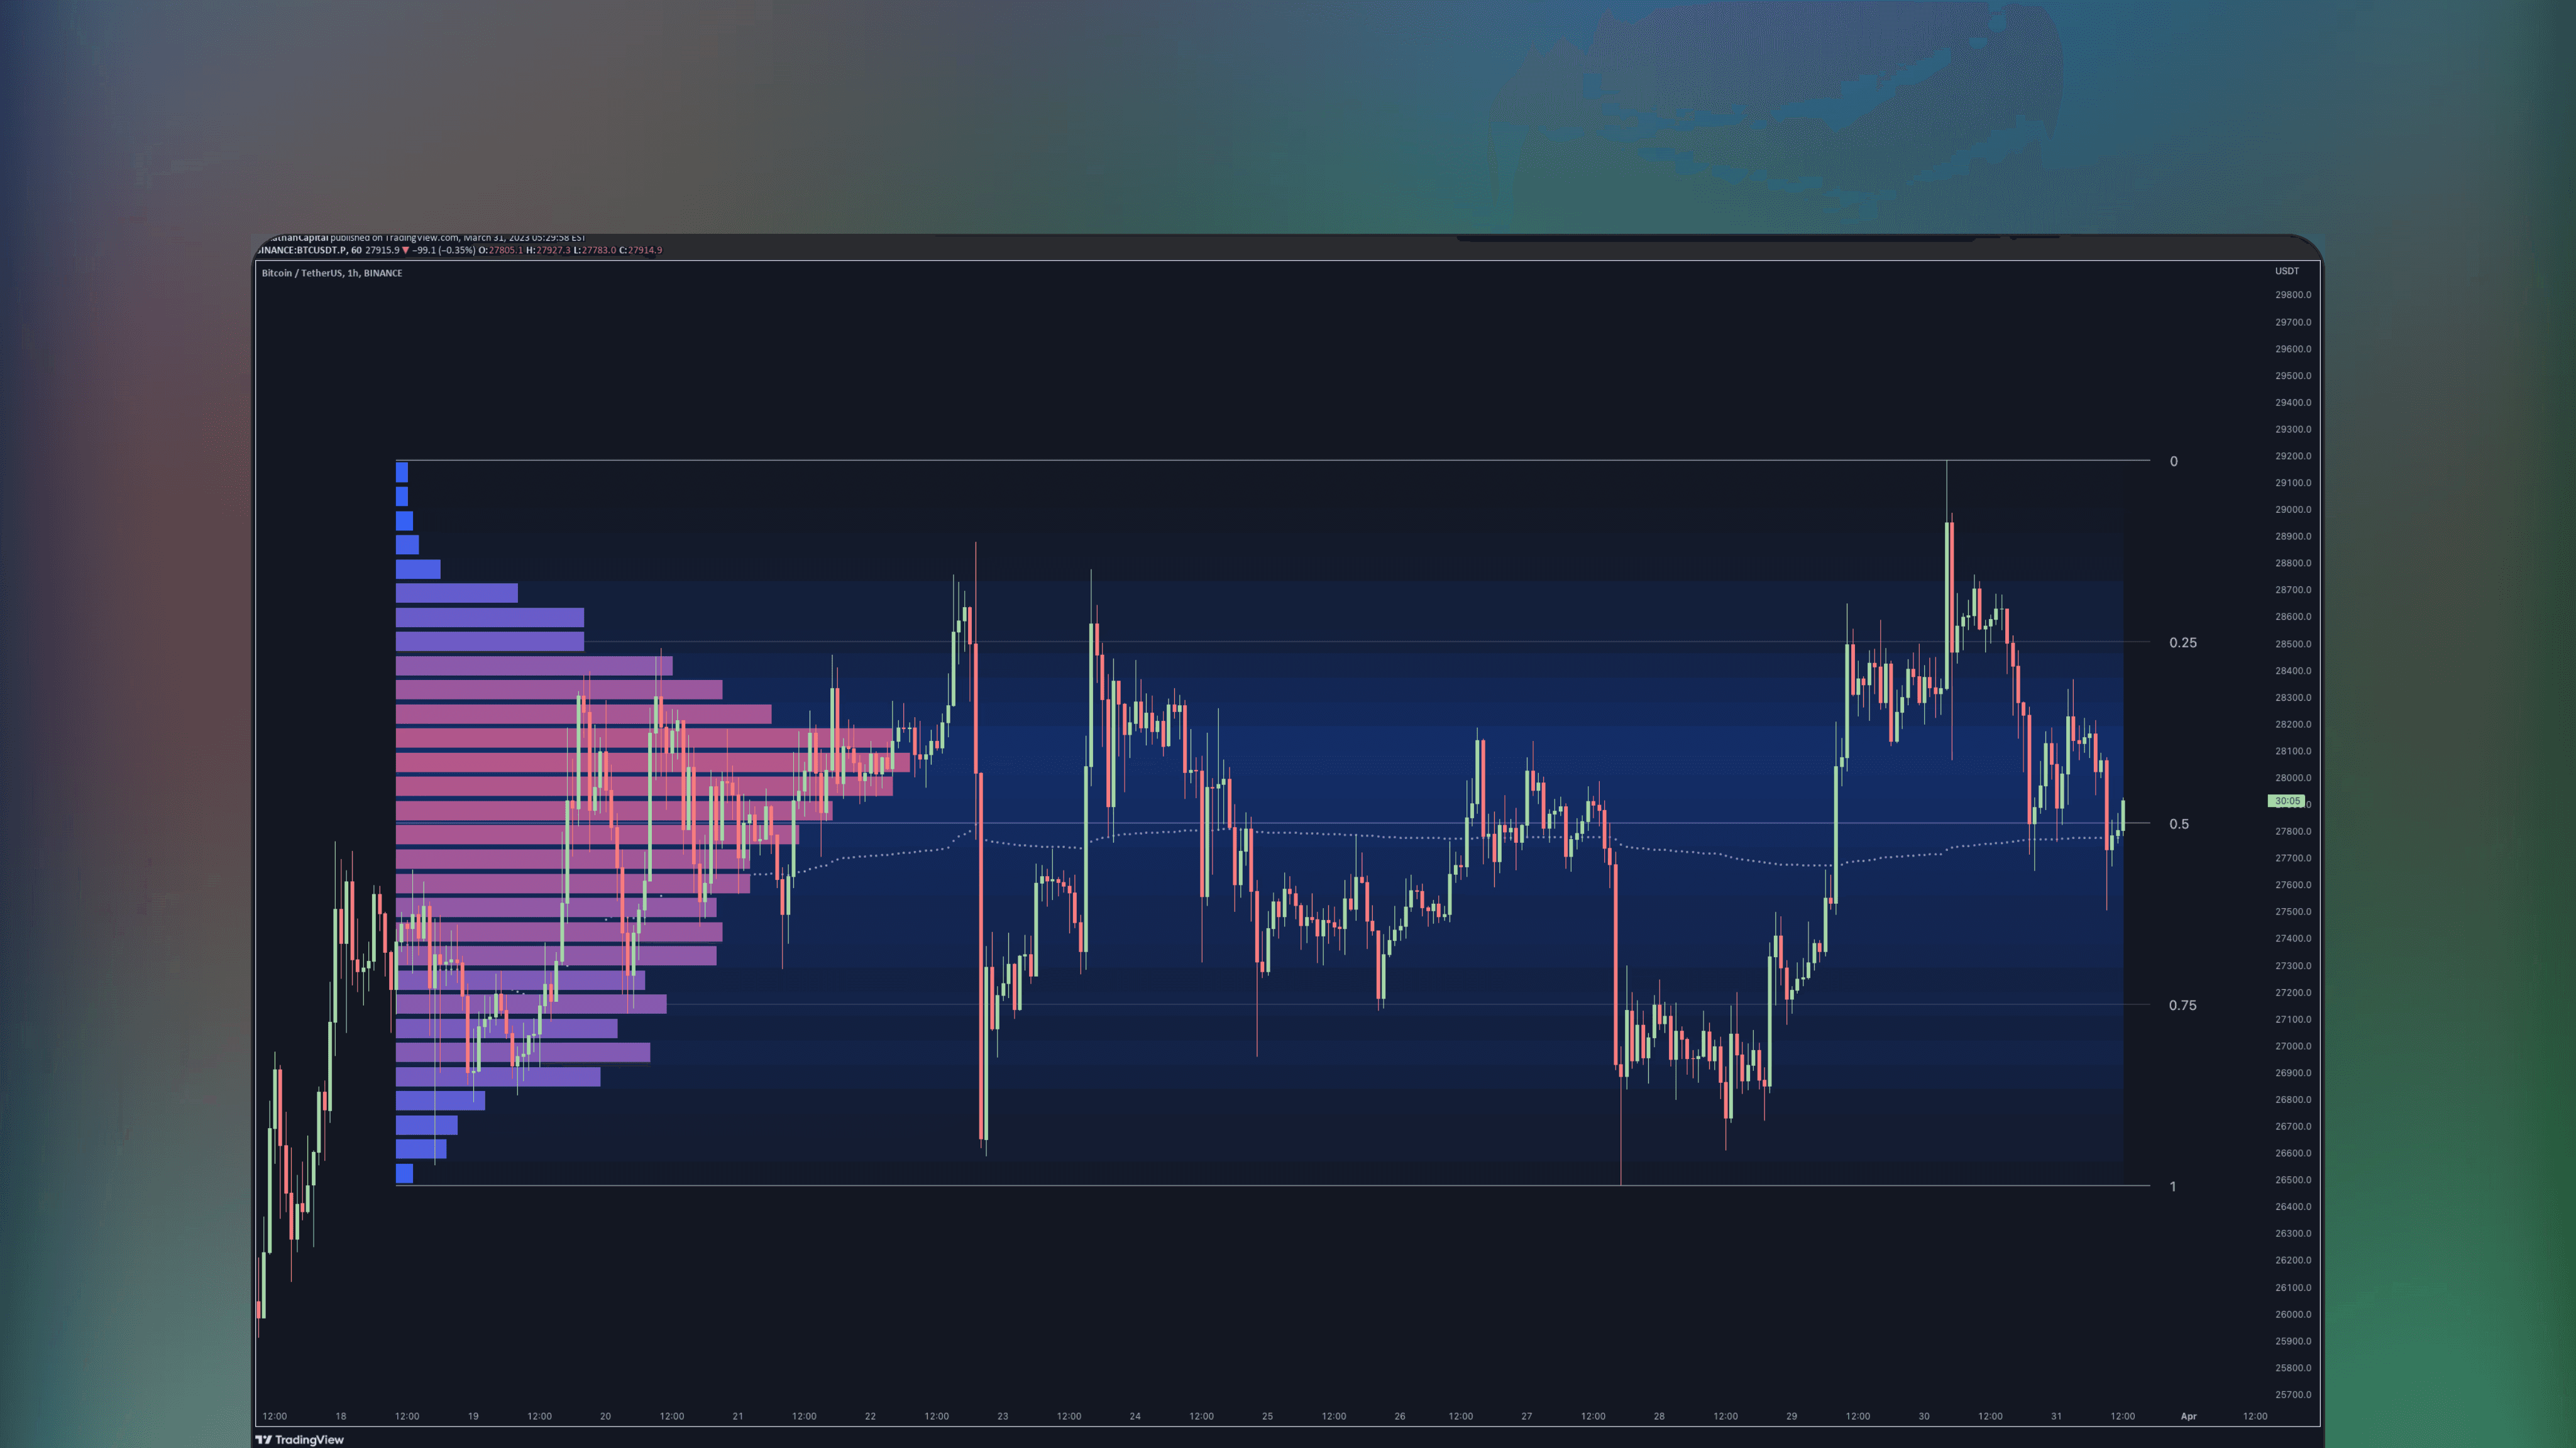
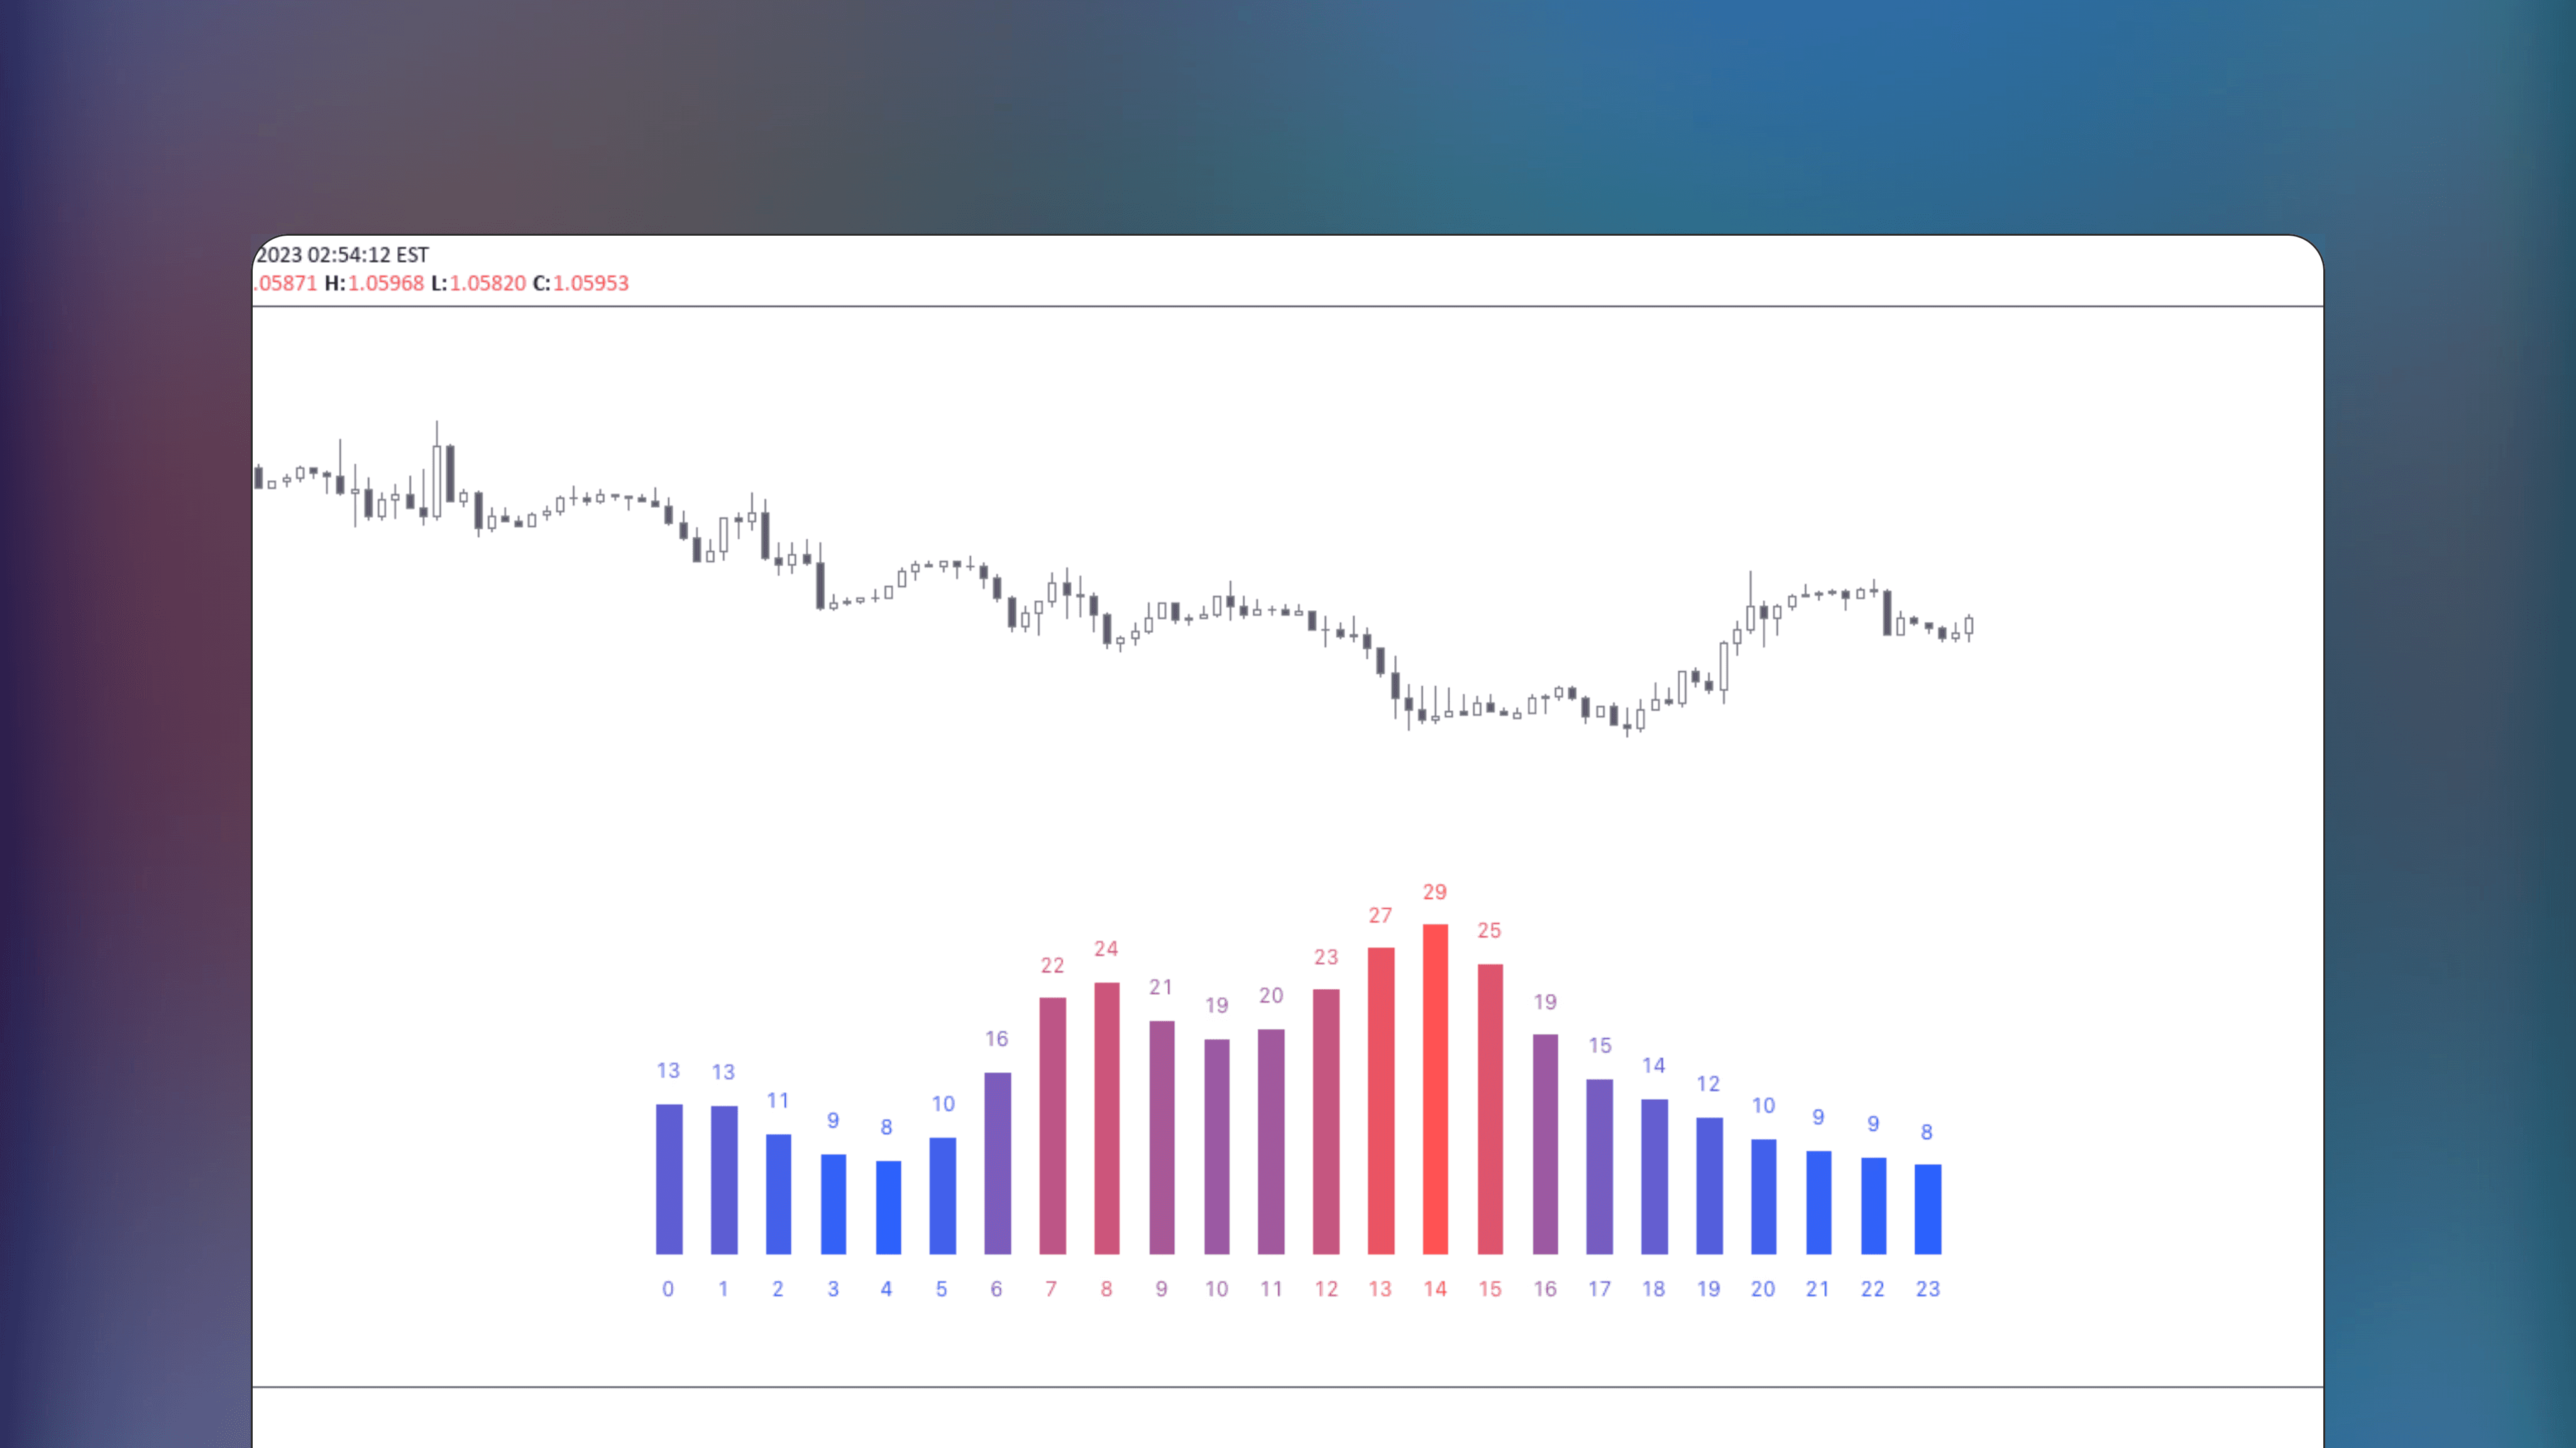
Identify price anomalies
Identify price anomalies
2
2
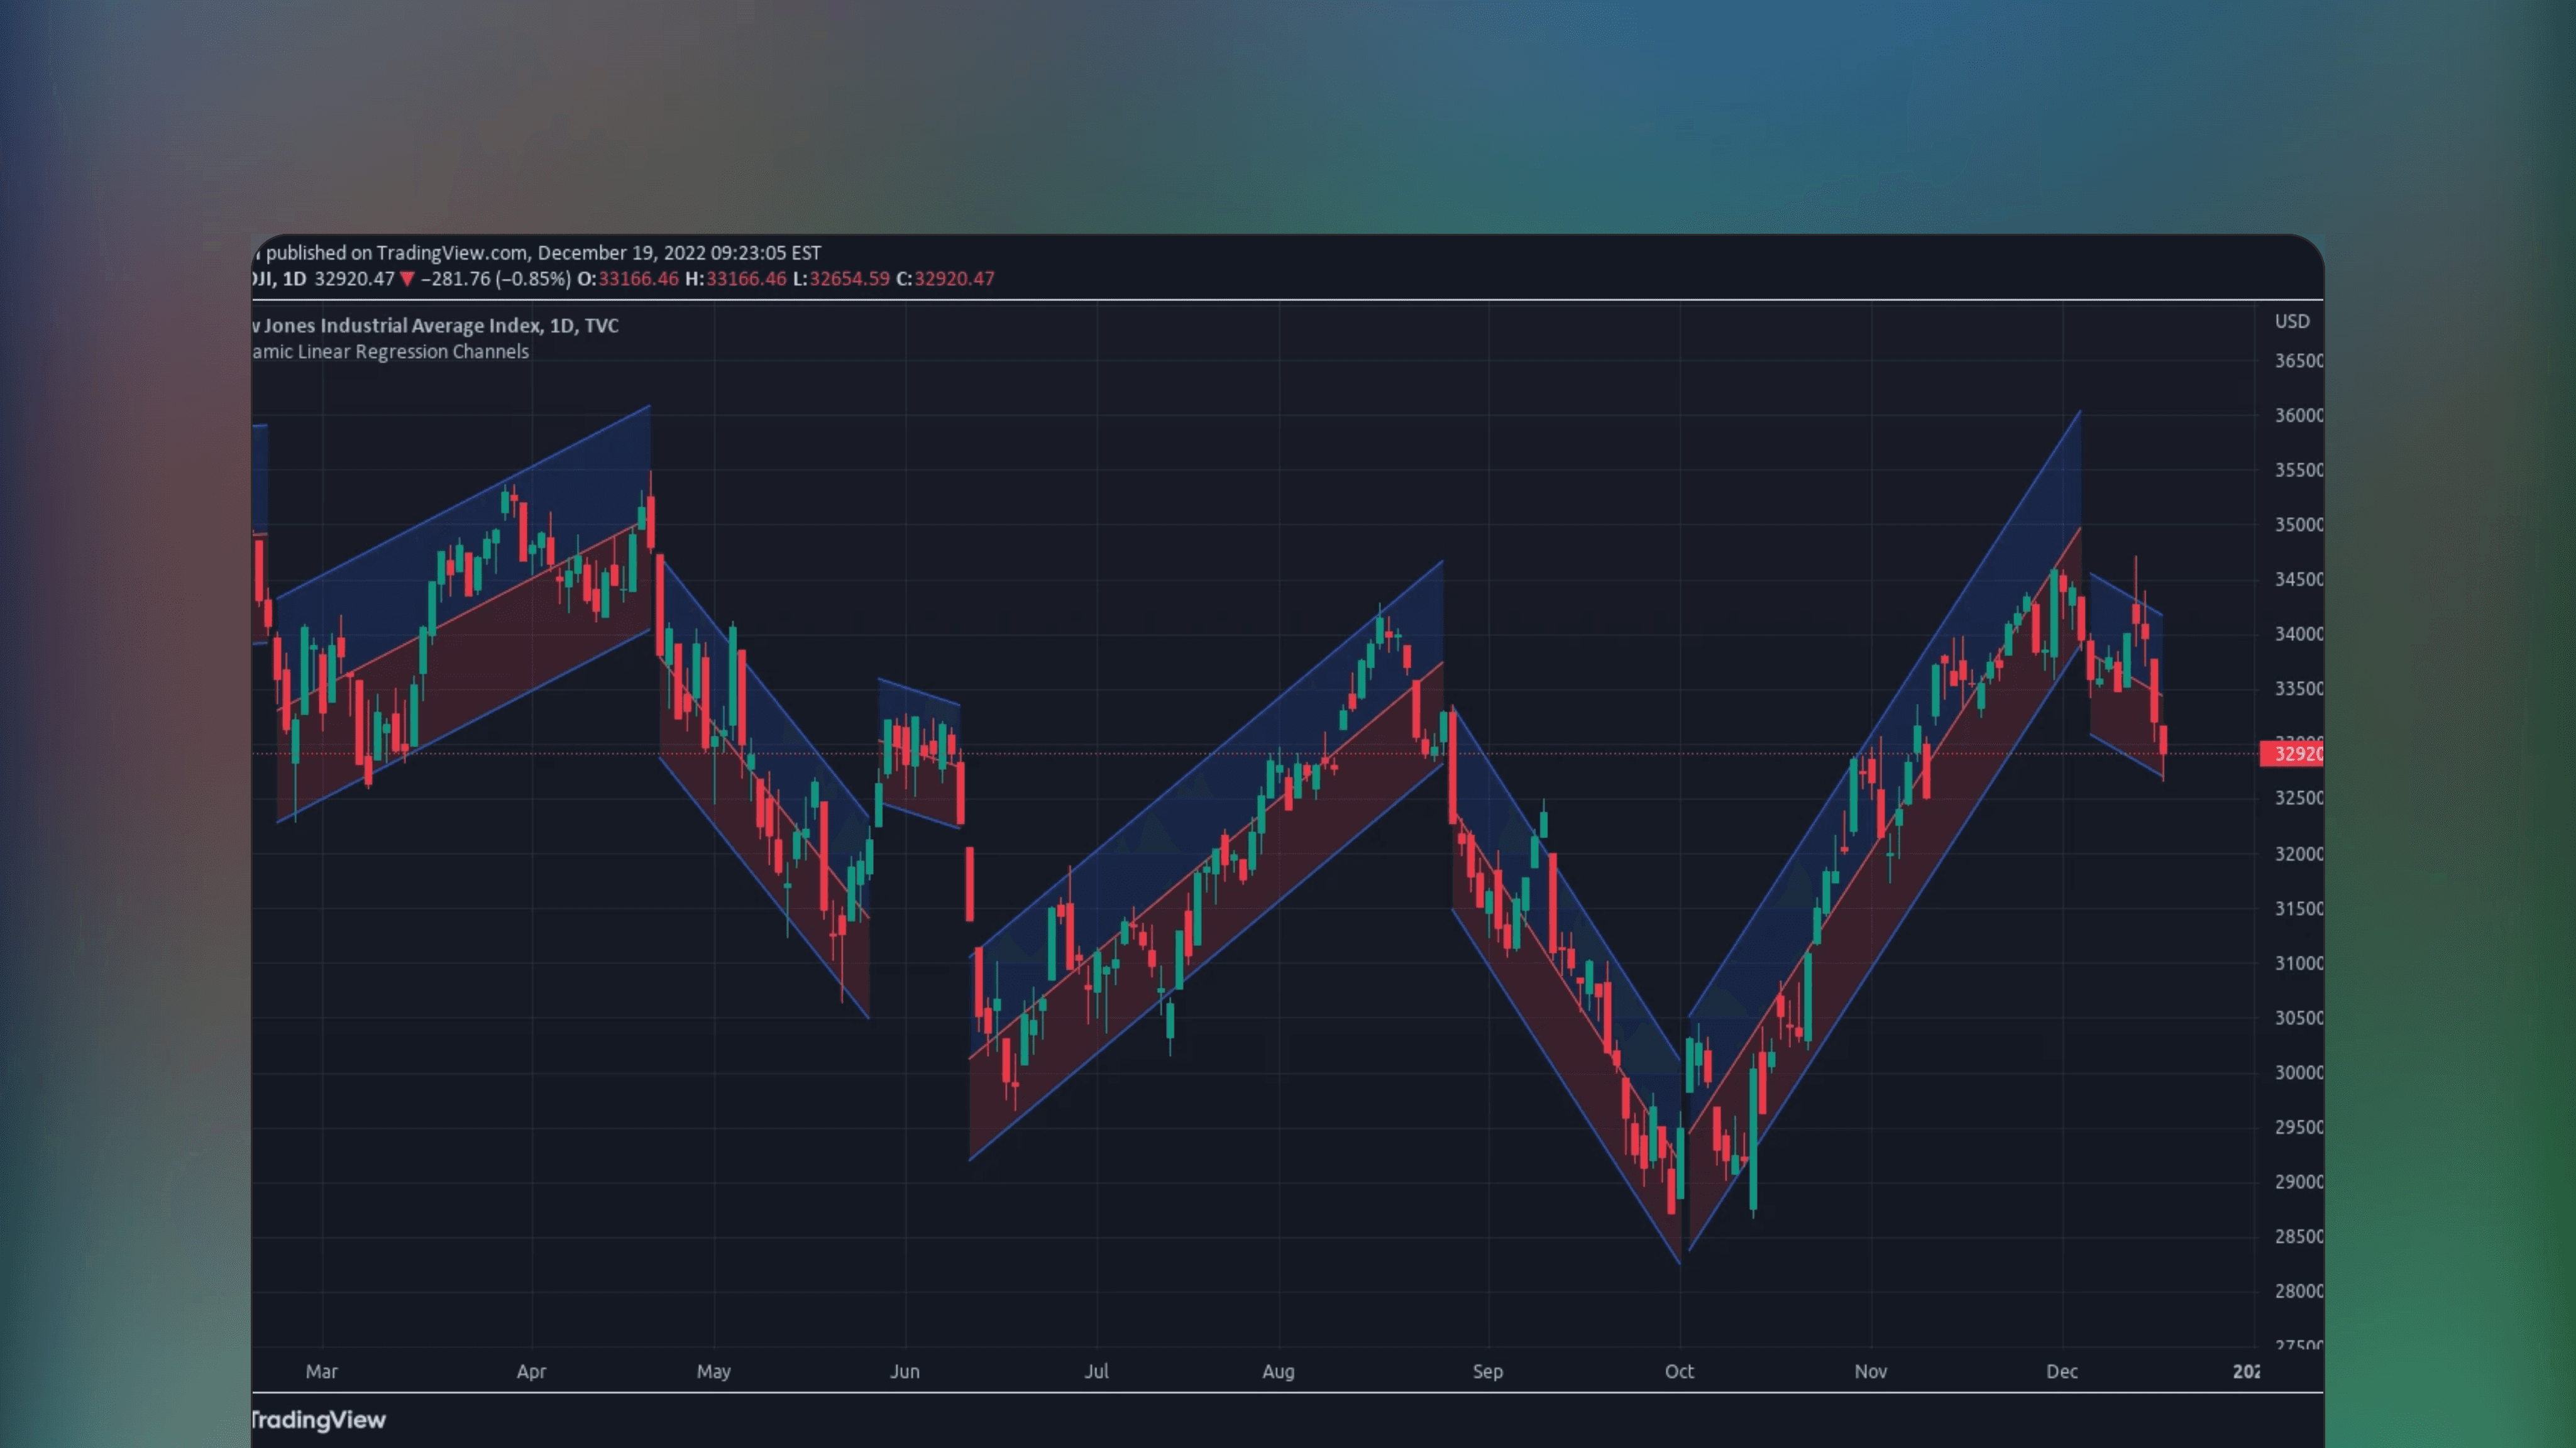
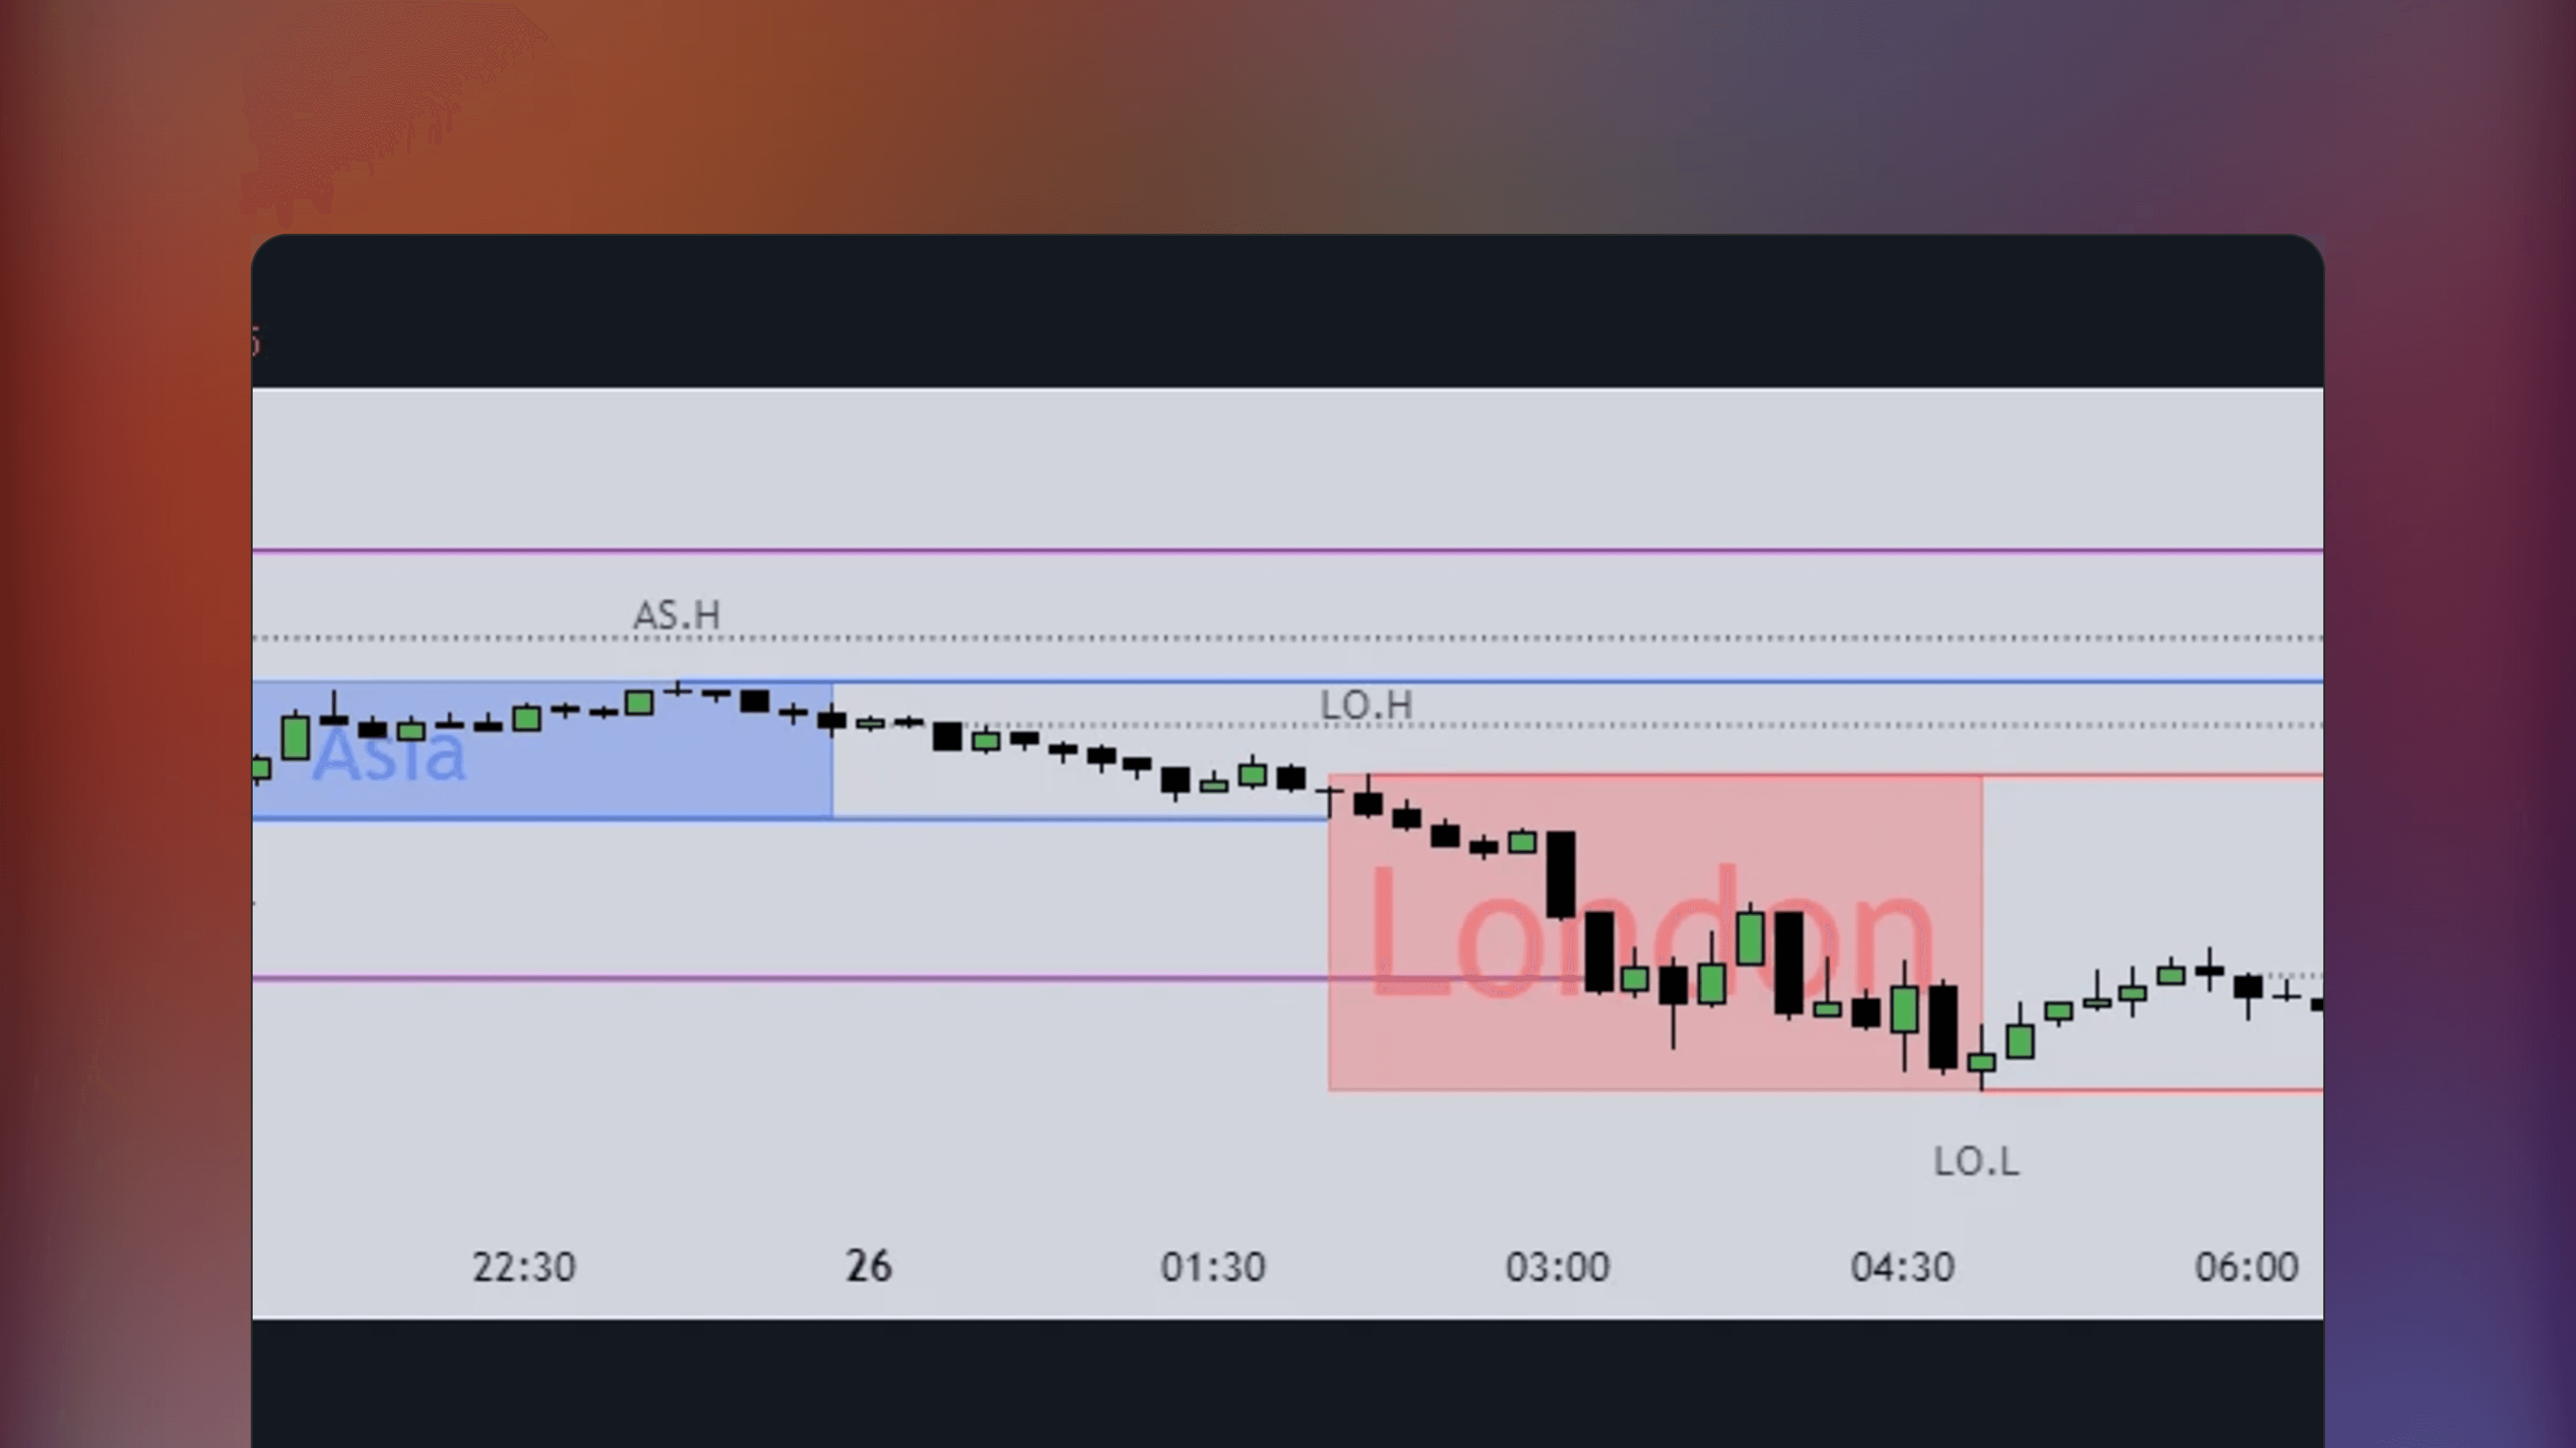
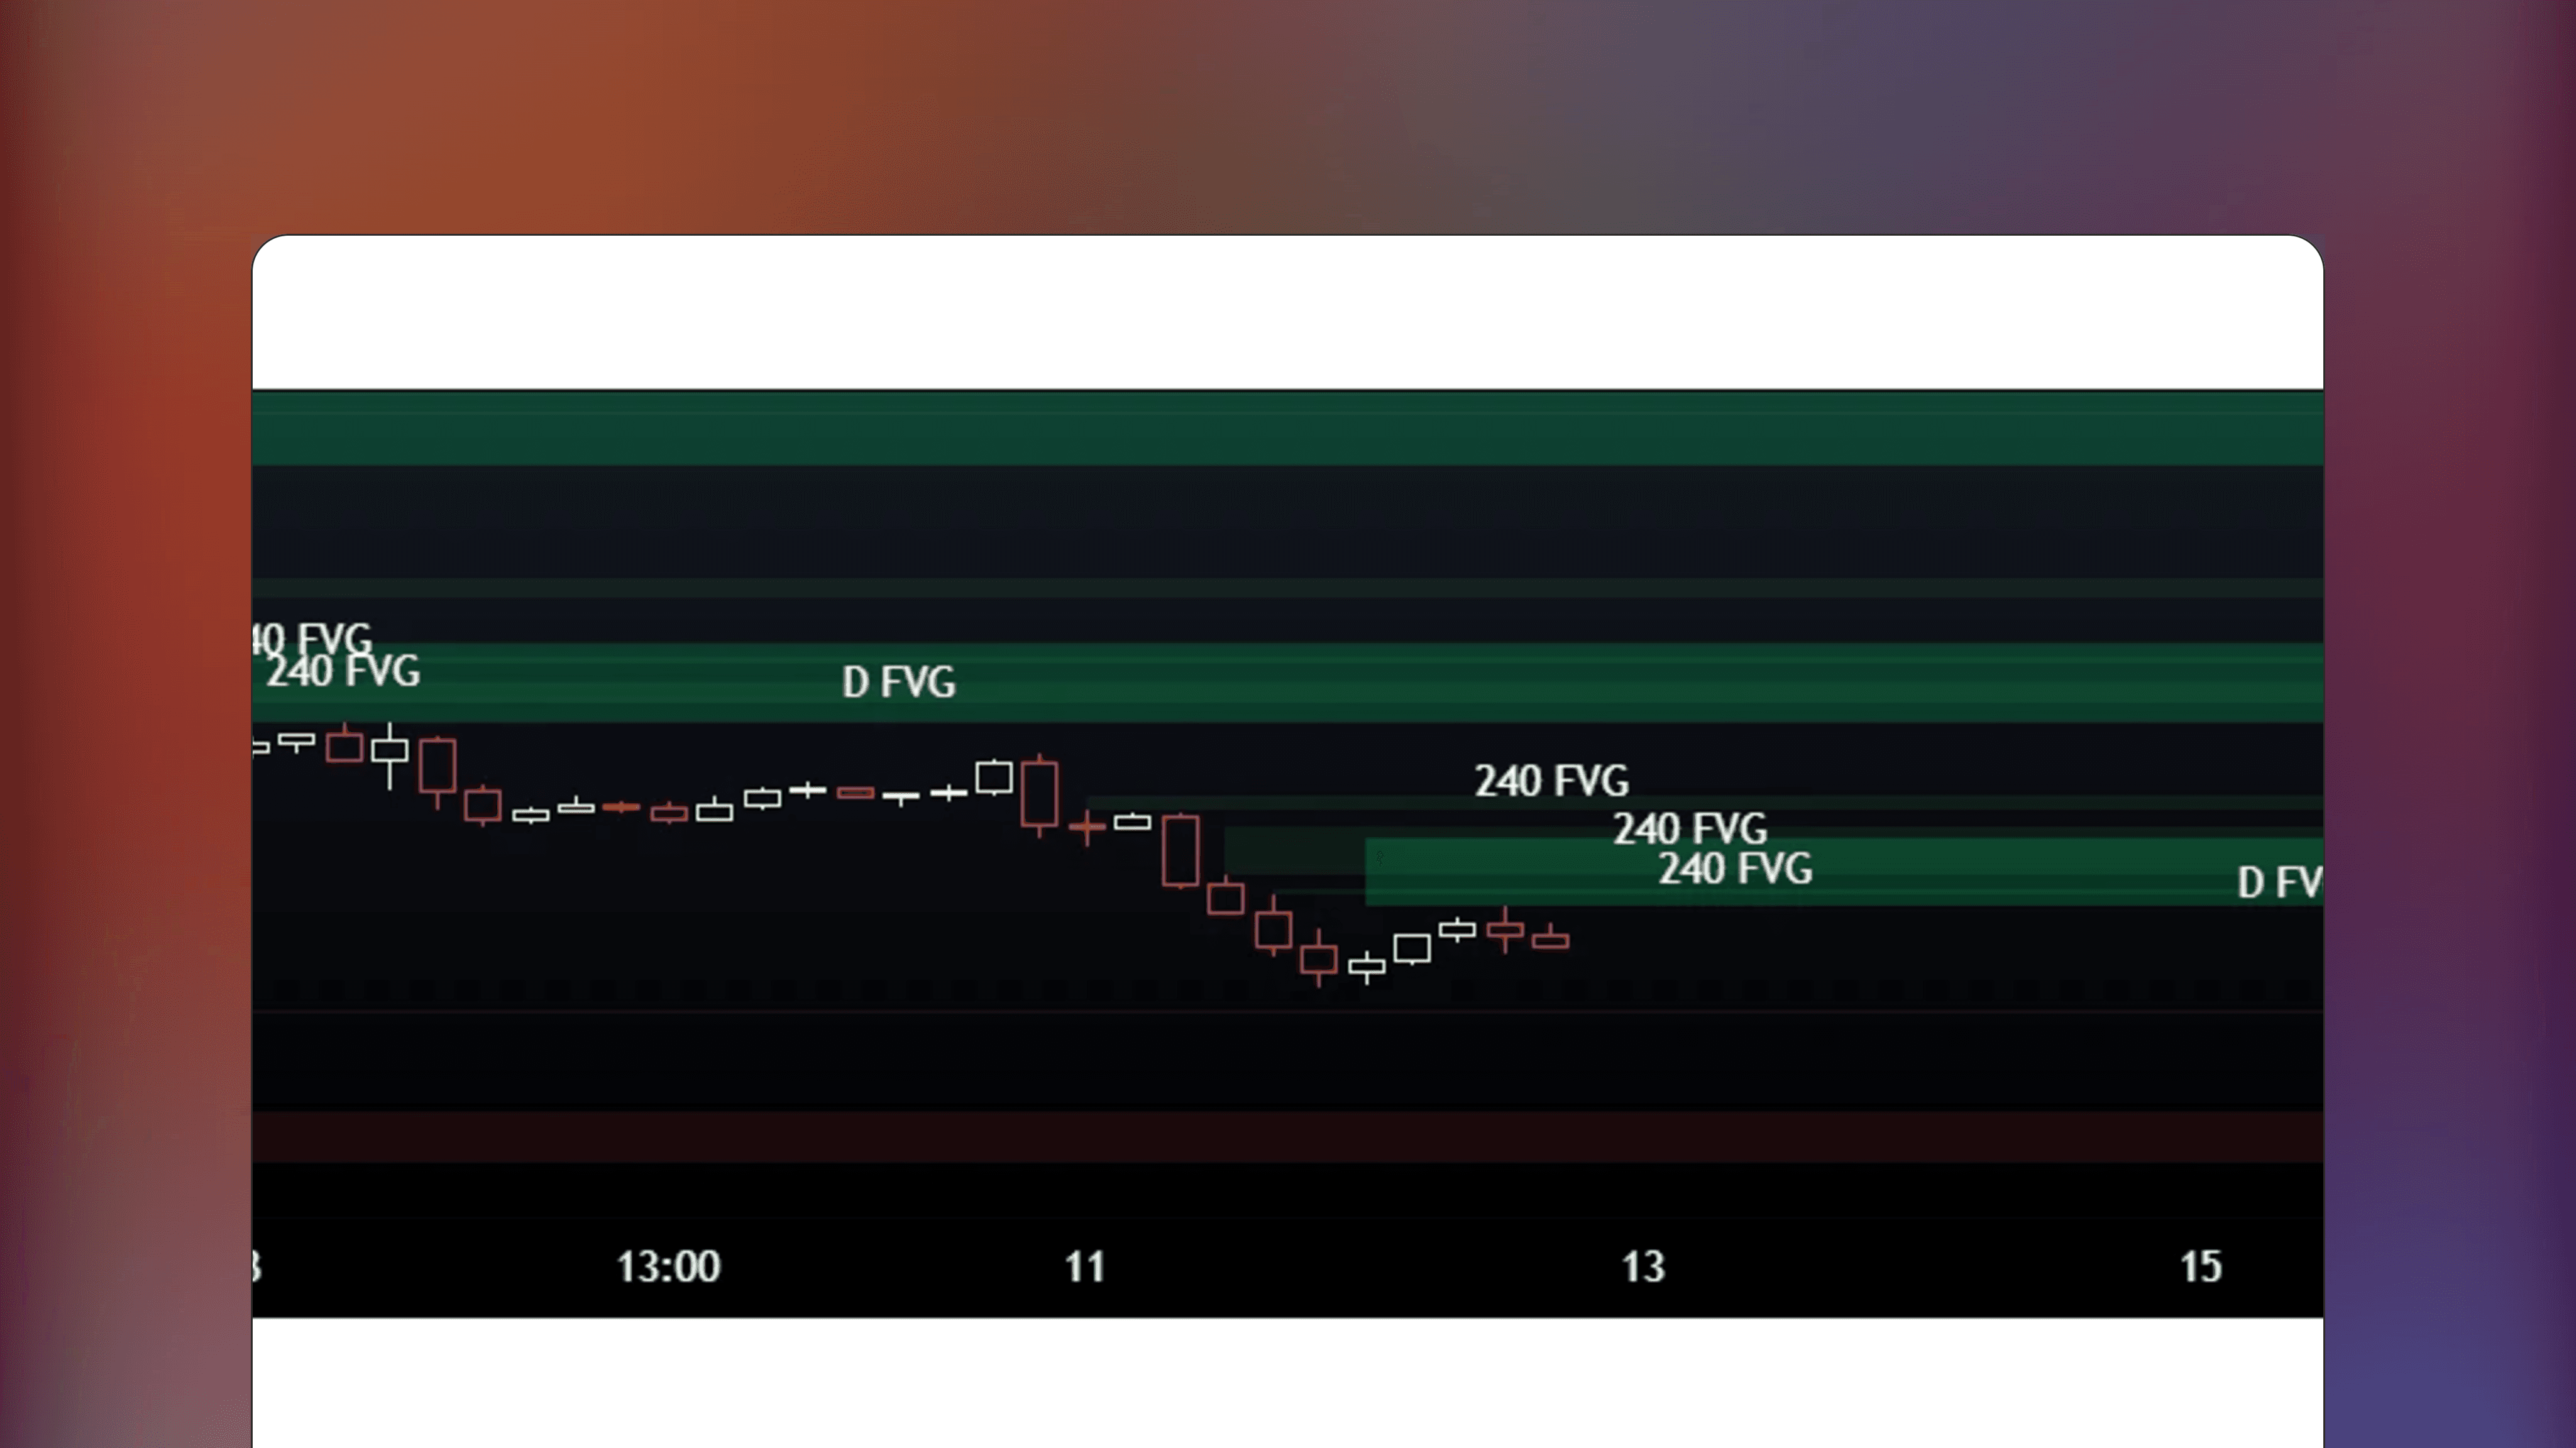
Identify potential key levels
Identify potential key levels
3
3
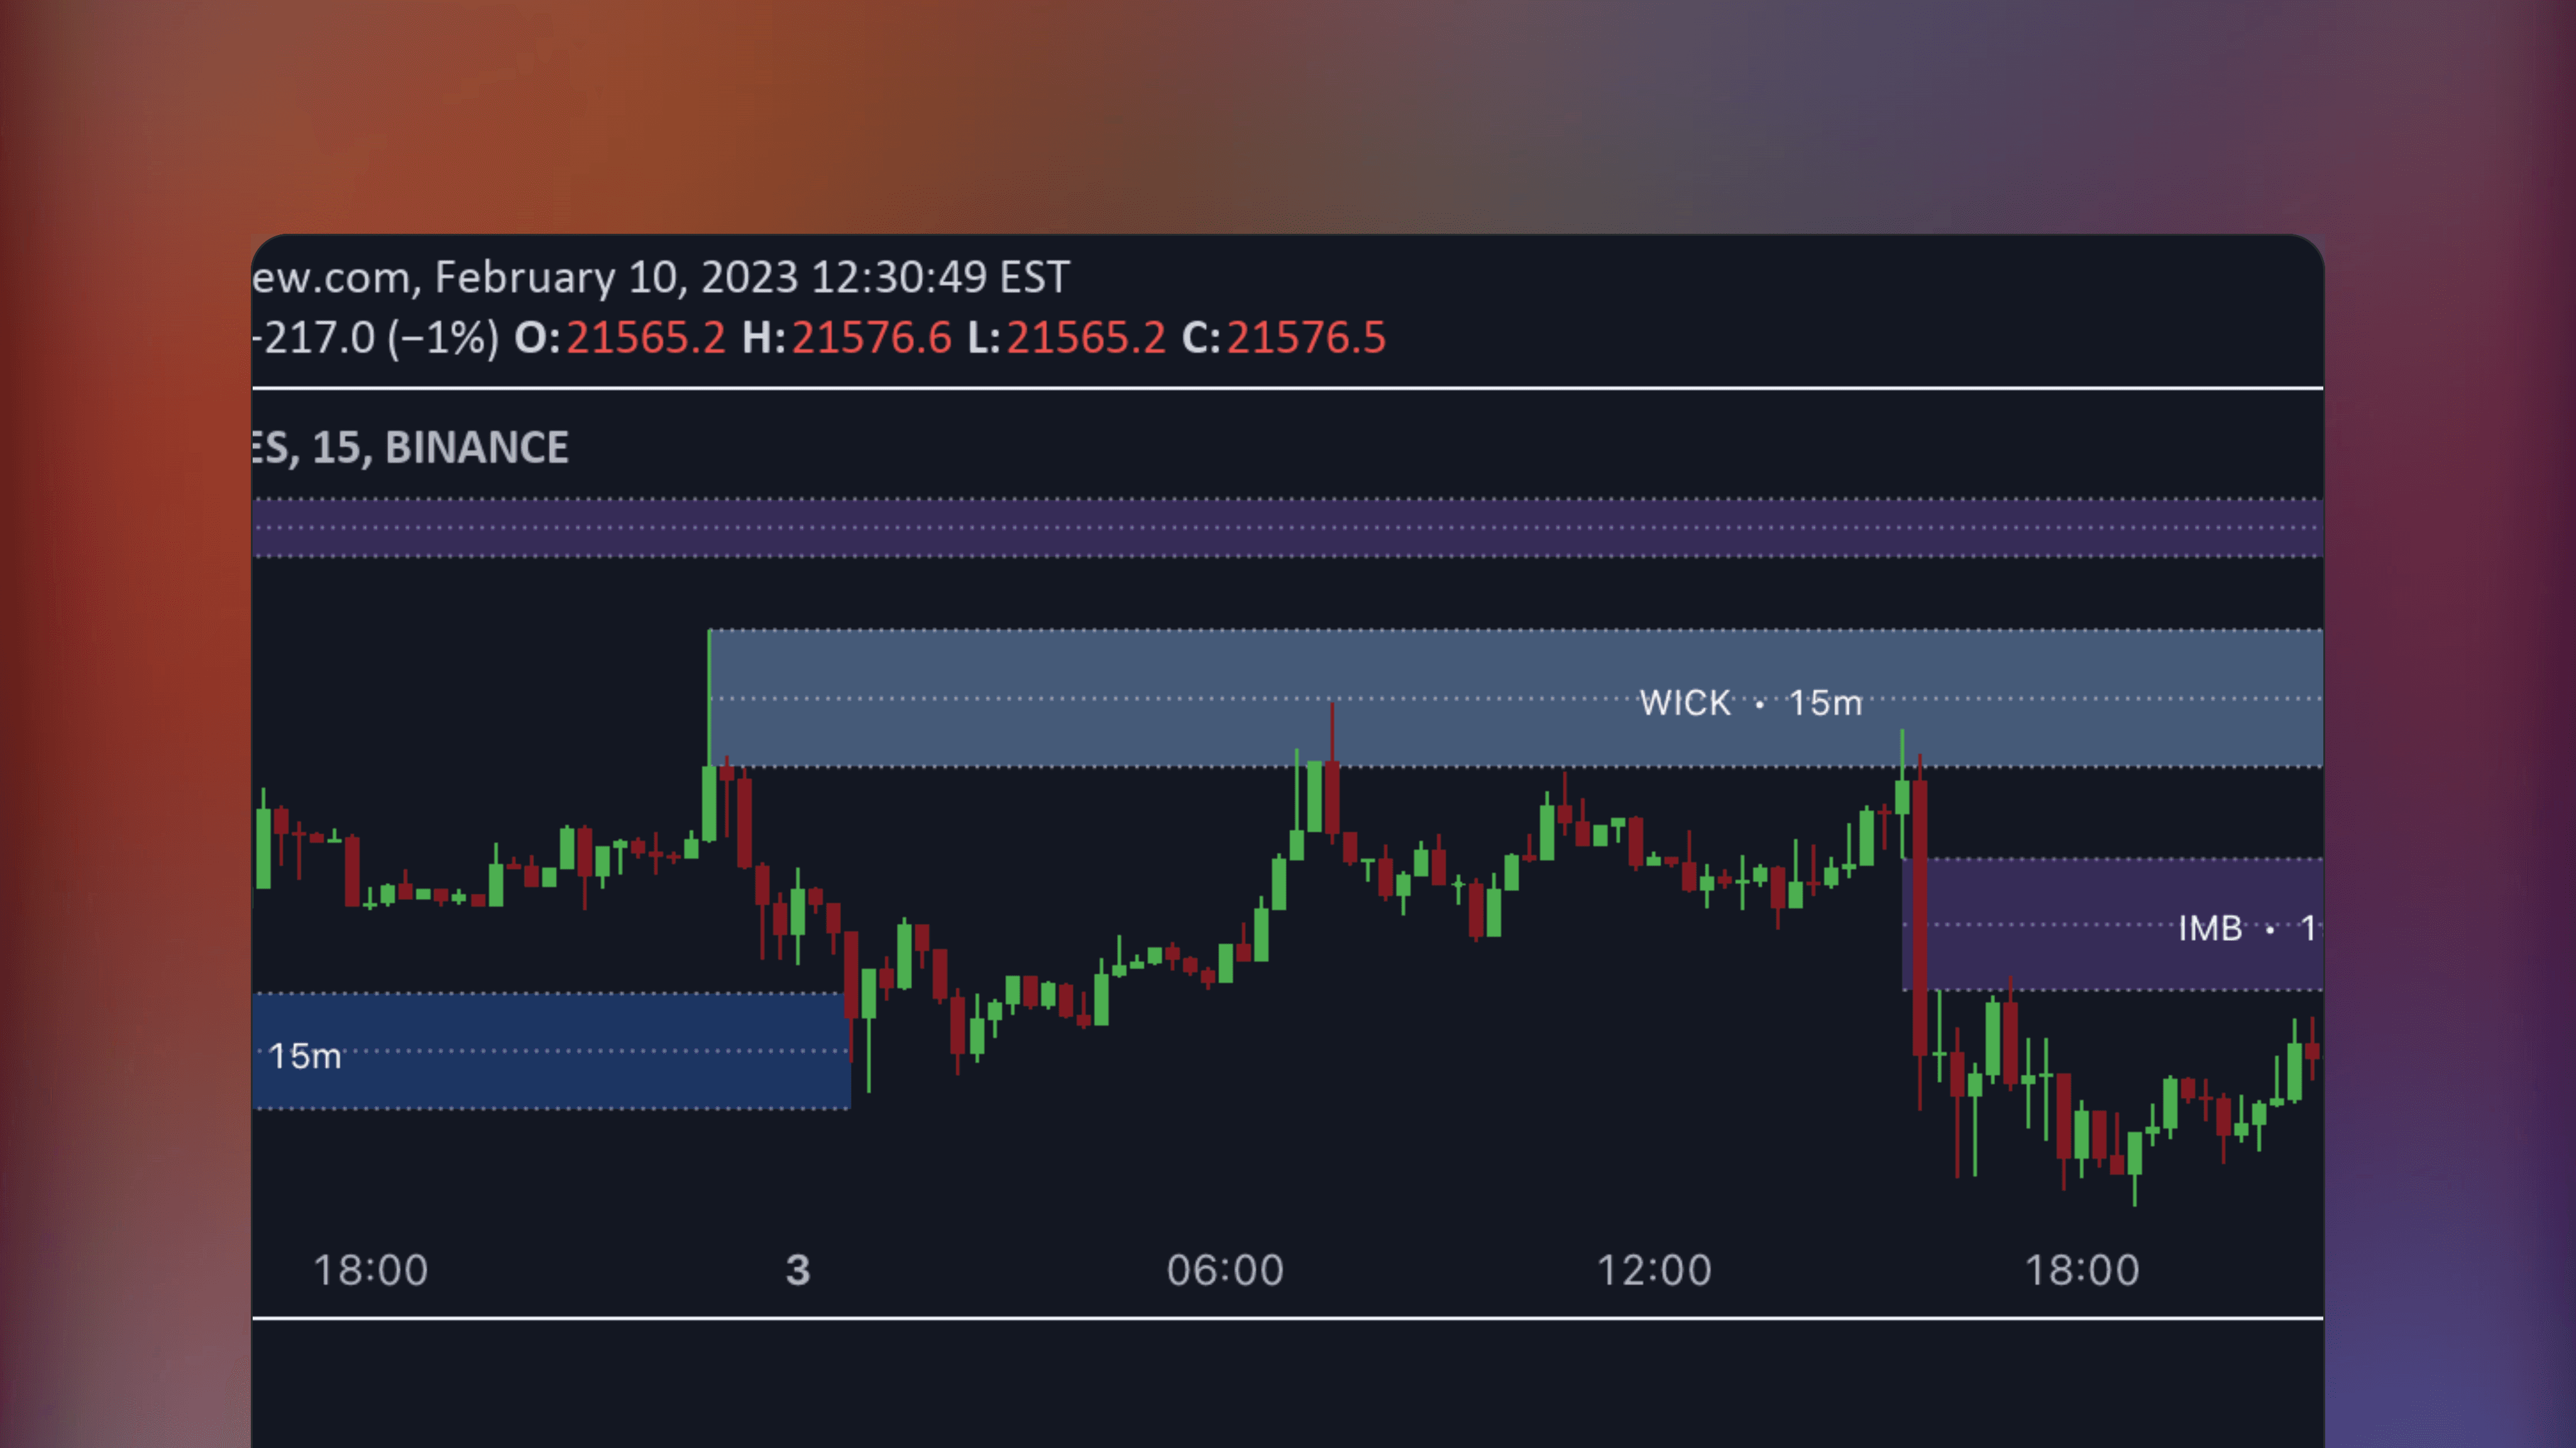
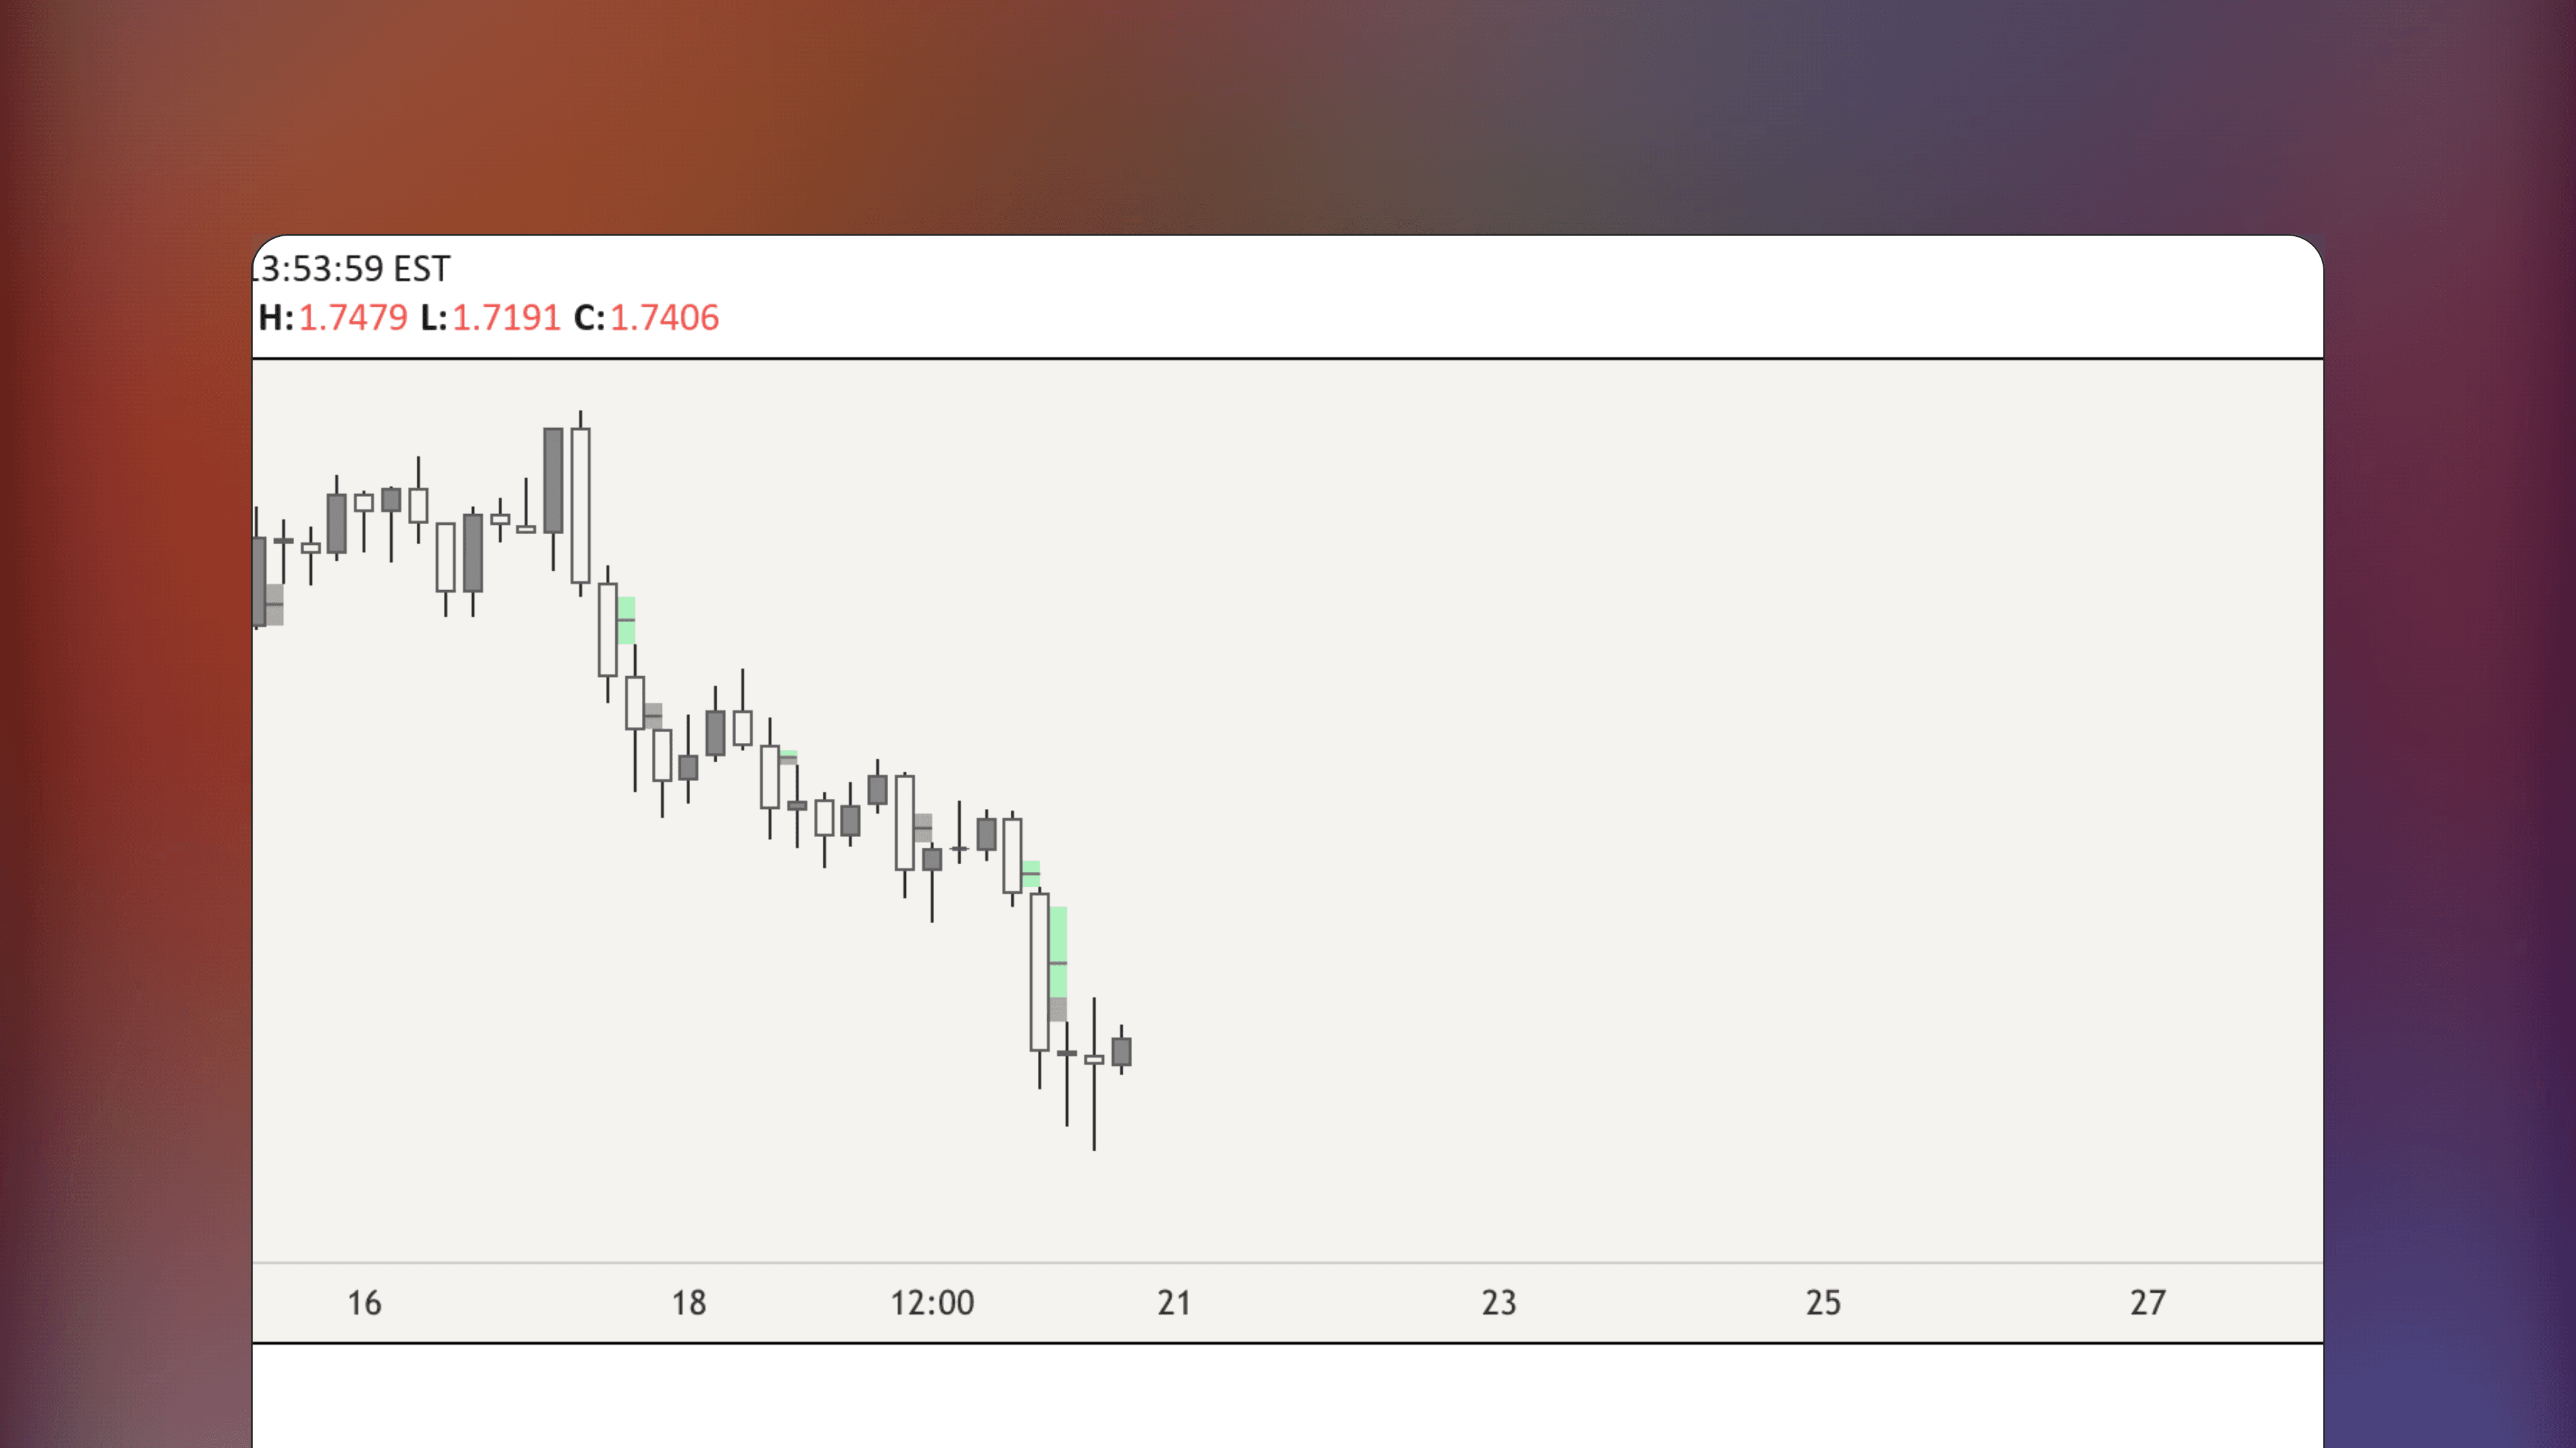
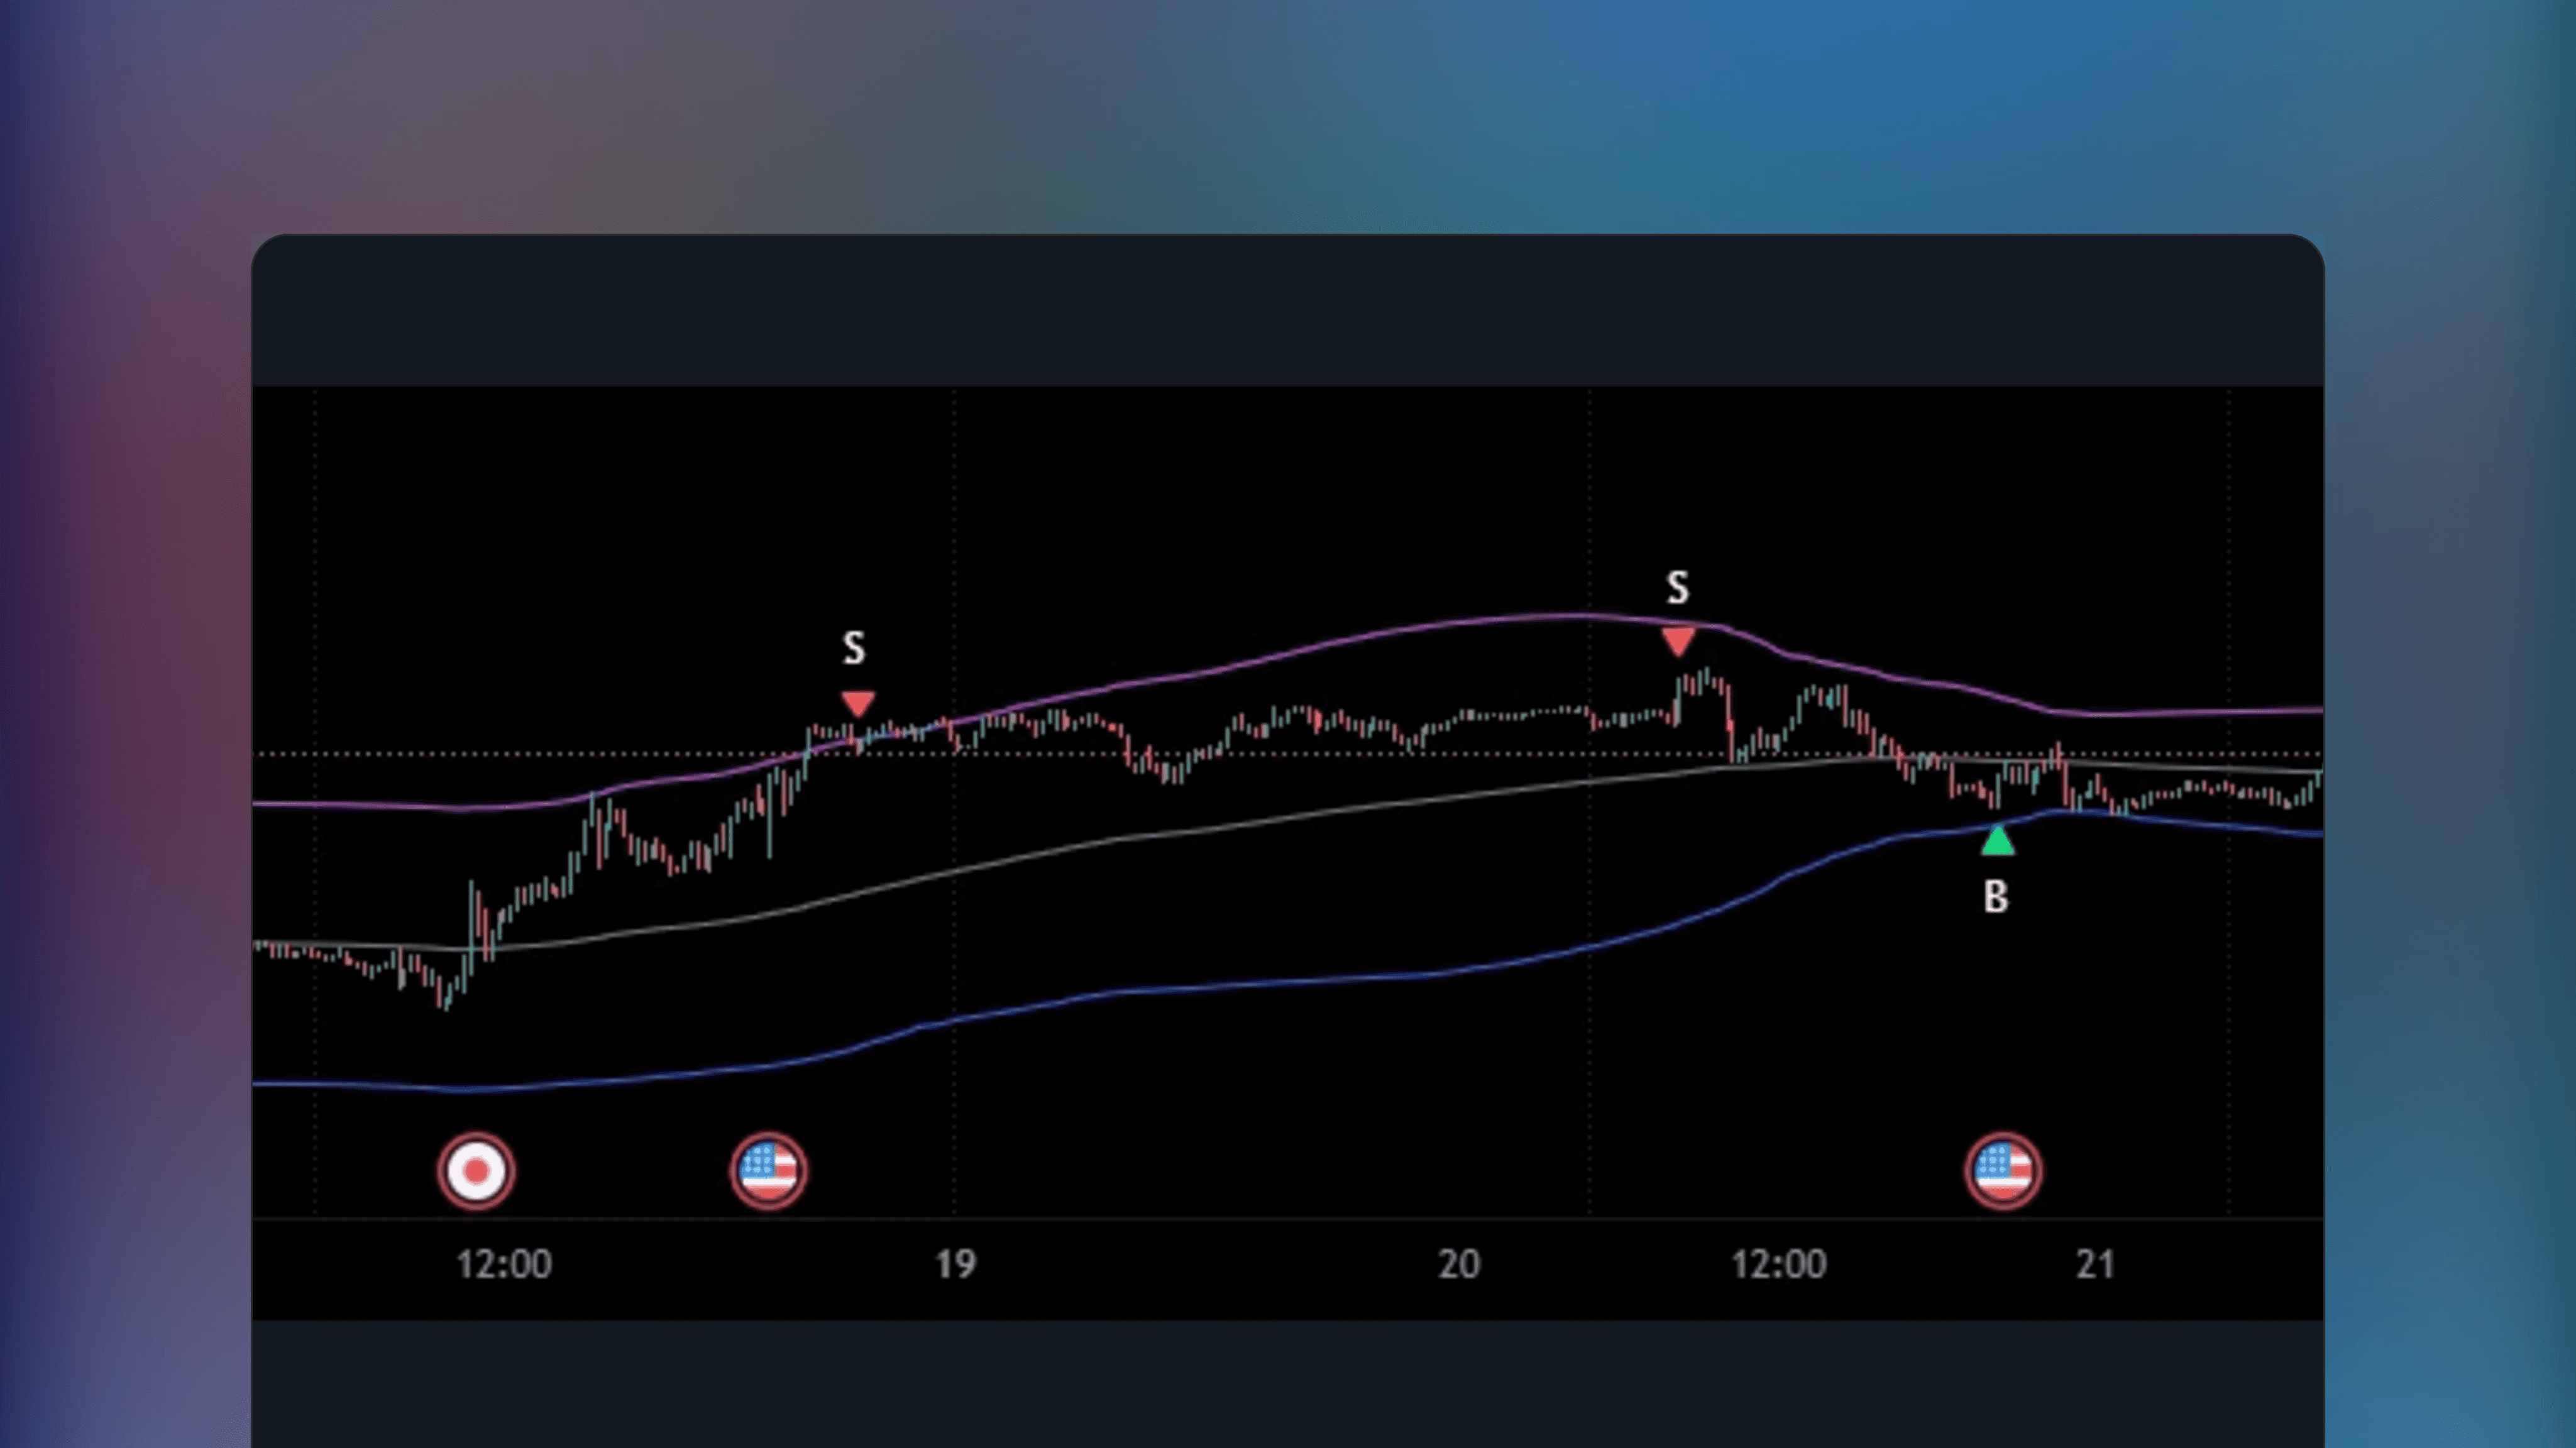
Identify potential trade targets
Identify potential trade targets
😃
😃
Traders are happy with this
Traders are happy with this
Overall, traders view Liquidity Raid - Stop Hunt as a helpful tool, with positive sentiment from users who understand market principles, though feedback is limited.
Overall, traders view Liquidity Raid - Stop Hunt as a helpful tool, with positive sentiment from users who understand market principles, though feedback is limited.
Source: Online Discussion
Source: Online Discussion
Source: Online Discussion


Bookmark
Saved here
🤖
Get Indicator
Find Indicator
3
Comments
Read on Telegram
Listing by third party publisher. Not financial advice.
Risk Disclosure


Share Listing
🤖
🤖
Get Indicator
Get Indicator
Find Indicator
Find Indicator
Saved here
Bookmark
Listing by third party publisher. Not financial advice.
Listing by third party publisher. Not financial advice.
Risk Disclosure
Risk Disclosure
Share
🤖
3


🤖
3
🤖
3
✍️
By Author
More by geneclash
🤖
by geneclash

Free
TradingView Indicator
Fractal Break Imbalance / Fair Value Gap (FVG) / Liquidity Void
🔑
🏅
The Fractal Break Imbalance / FVG / Liquidity Void indicator is a free TradingView tool that marks order imbalances and liquidity voids by detecting excess buy or sell orders after swing high or swing low breakouts. Includes other types of imbalances as well.

🤖
by geneclash
Free
TradingView Indicator
MTF Market Structure Highs and Lows
🔑
🌐
🏅
MTF Market Structure Highs and Lows is a TradingView indicator that detects swing highs and lows across multiple timeframes (Weekly, Daily, 4H, 1H and more) to calculate market structure and potential resting liquidity swing levels.
🤖
by geneclash
Free
TradingView Indicator
Fractal Break Imbalance / Fair Value Gap (FVG) / Liquidity Void
🔑
🏅
The Fractal Break Imbalance / FVG / Liquidity Void indicator is a free TradingView tool that marks order imbalances and liquidity voids by detecting excess buy or sell orders after swing high or swing low breakouts. Includes other types of imbalances as well.
🤖
by geneclash
Free
TradingView Indicator
MTF Market Structure Highs and Lows
🔑
🌐
🏅
MTF Market Structure Highs and Lows is a TradingView indicator that detects swing highs and lows across multiple timeframes (Weekly, Daily, 4H, 1H and more) to calculate market structure and potential resting liquidity swing levels.
🔥
New Listings
Featured this week

🤖
by benten


Free
ThinkOrSwim Indicator
Triple VWAP Indicator For ThinkOrSwim
New
🔑
✅
Triple VWAP Indicator for ThinkorSwim VWAP by adding 1 to 3 standard deviation bands alongside VWAP, providing a more detailed view of extreme deviations based on market volatility.
🤖
by scriptor


Free
MetaTrader Indicator
Volume_Accumulation
New
🔑
🌐
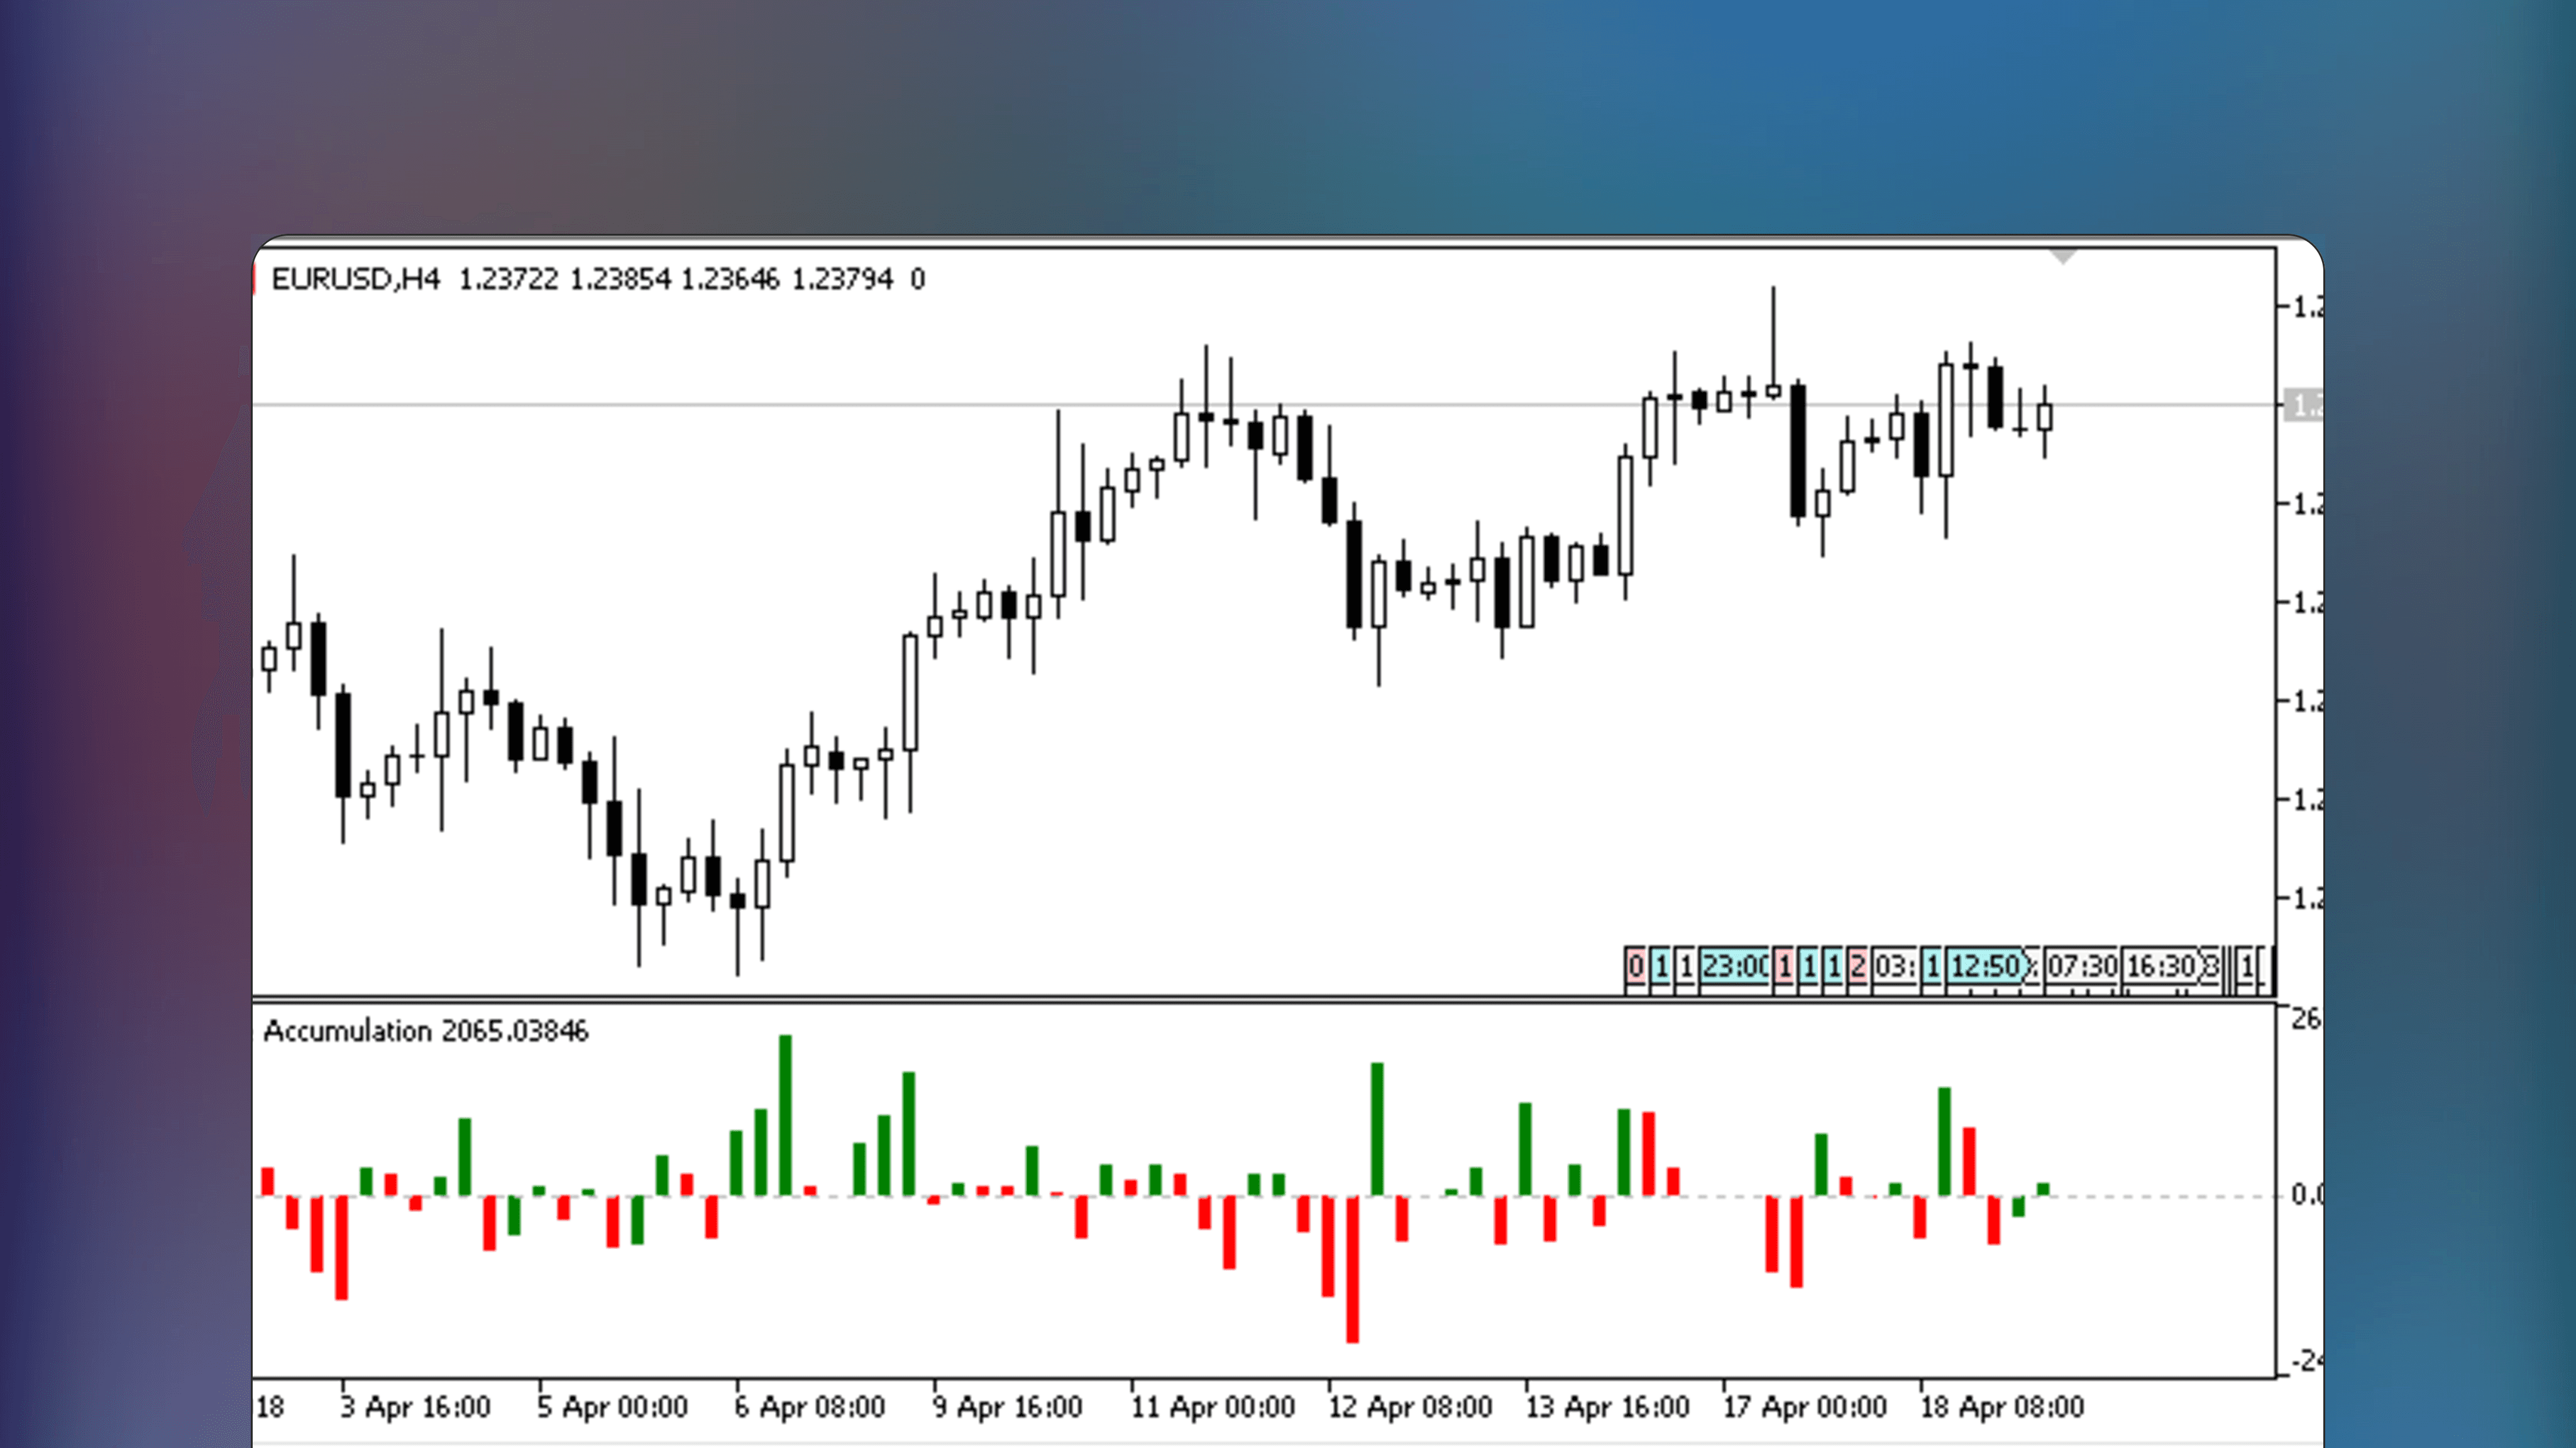
Volume_Accumulation is a MetaTrader Indicator that displays volume accumulation and distribution using a specialized formula. The indicator requires no inputs or settings, simply start using.
🤖
by twingall
Free
TradingView Indicator
FVGs & CEs + Alerts: simple & efficient method
New
🔑
✅
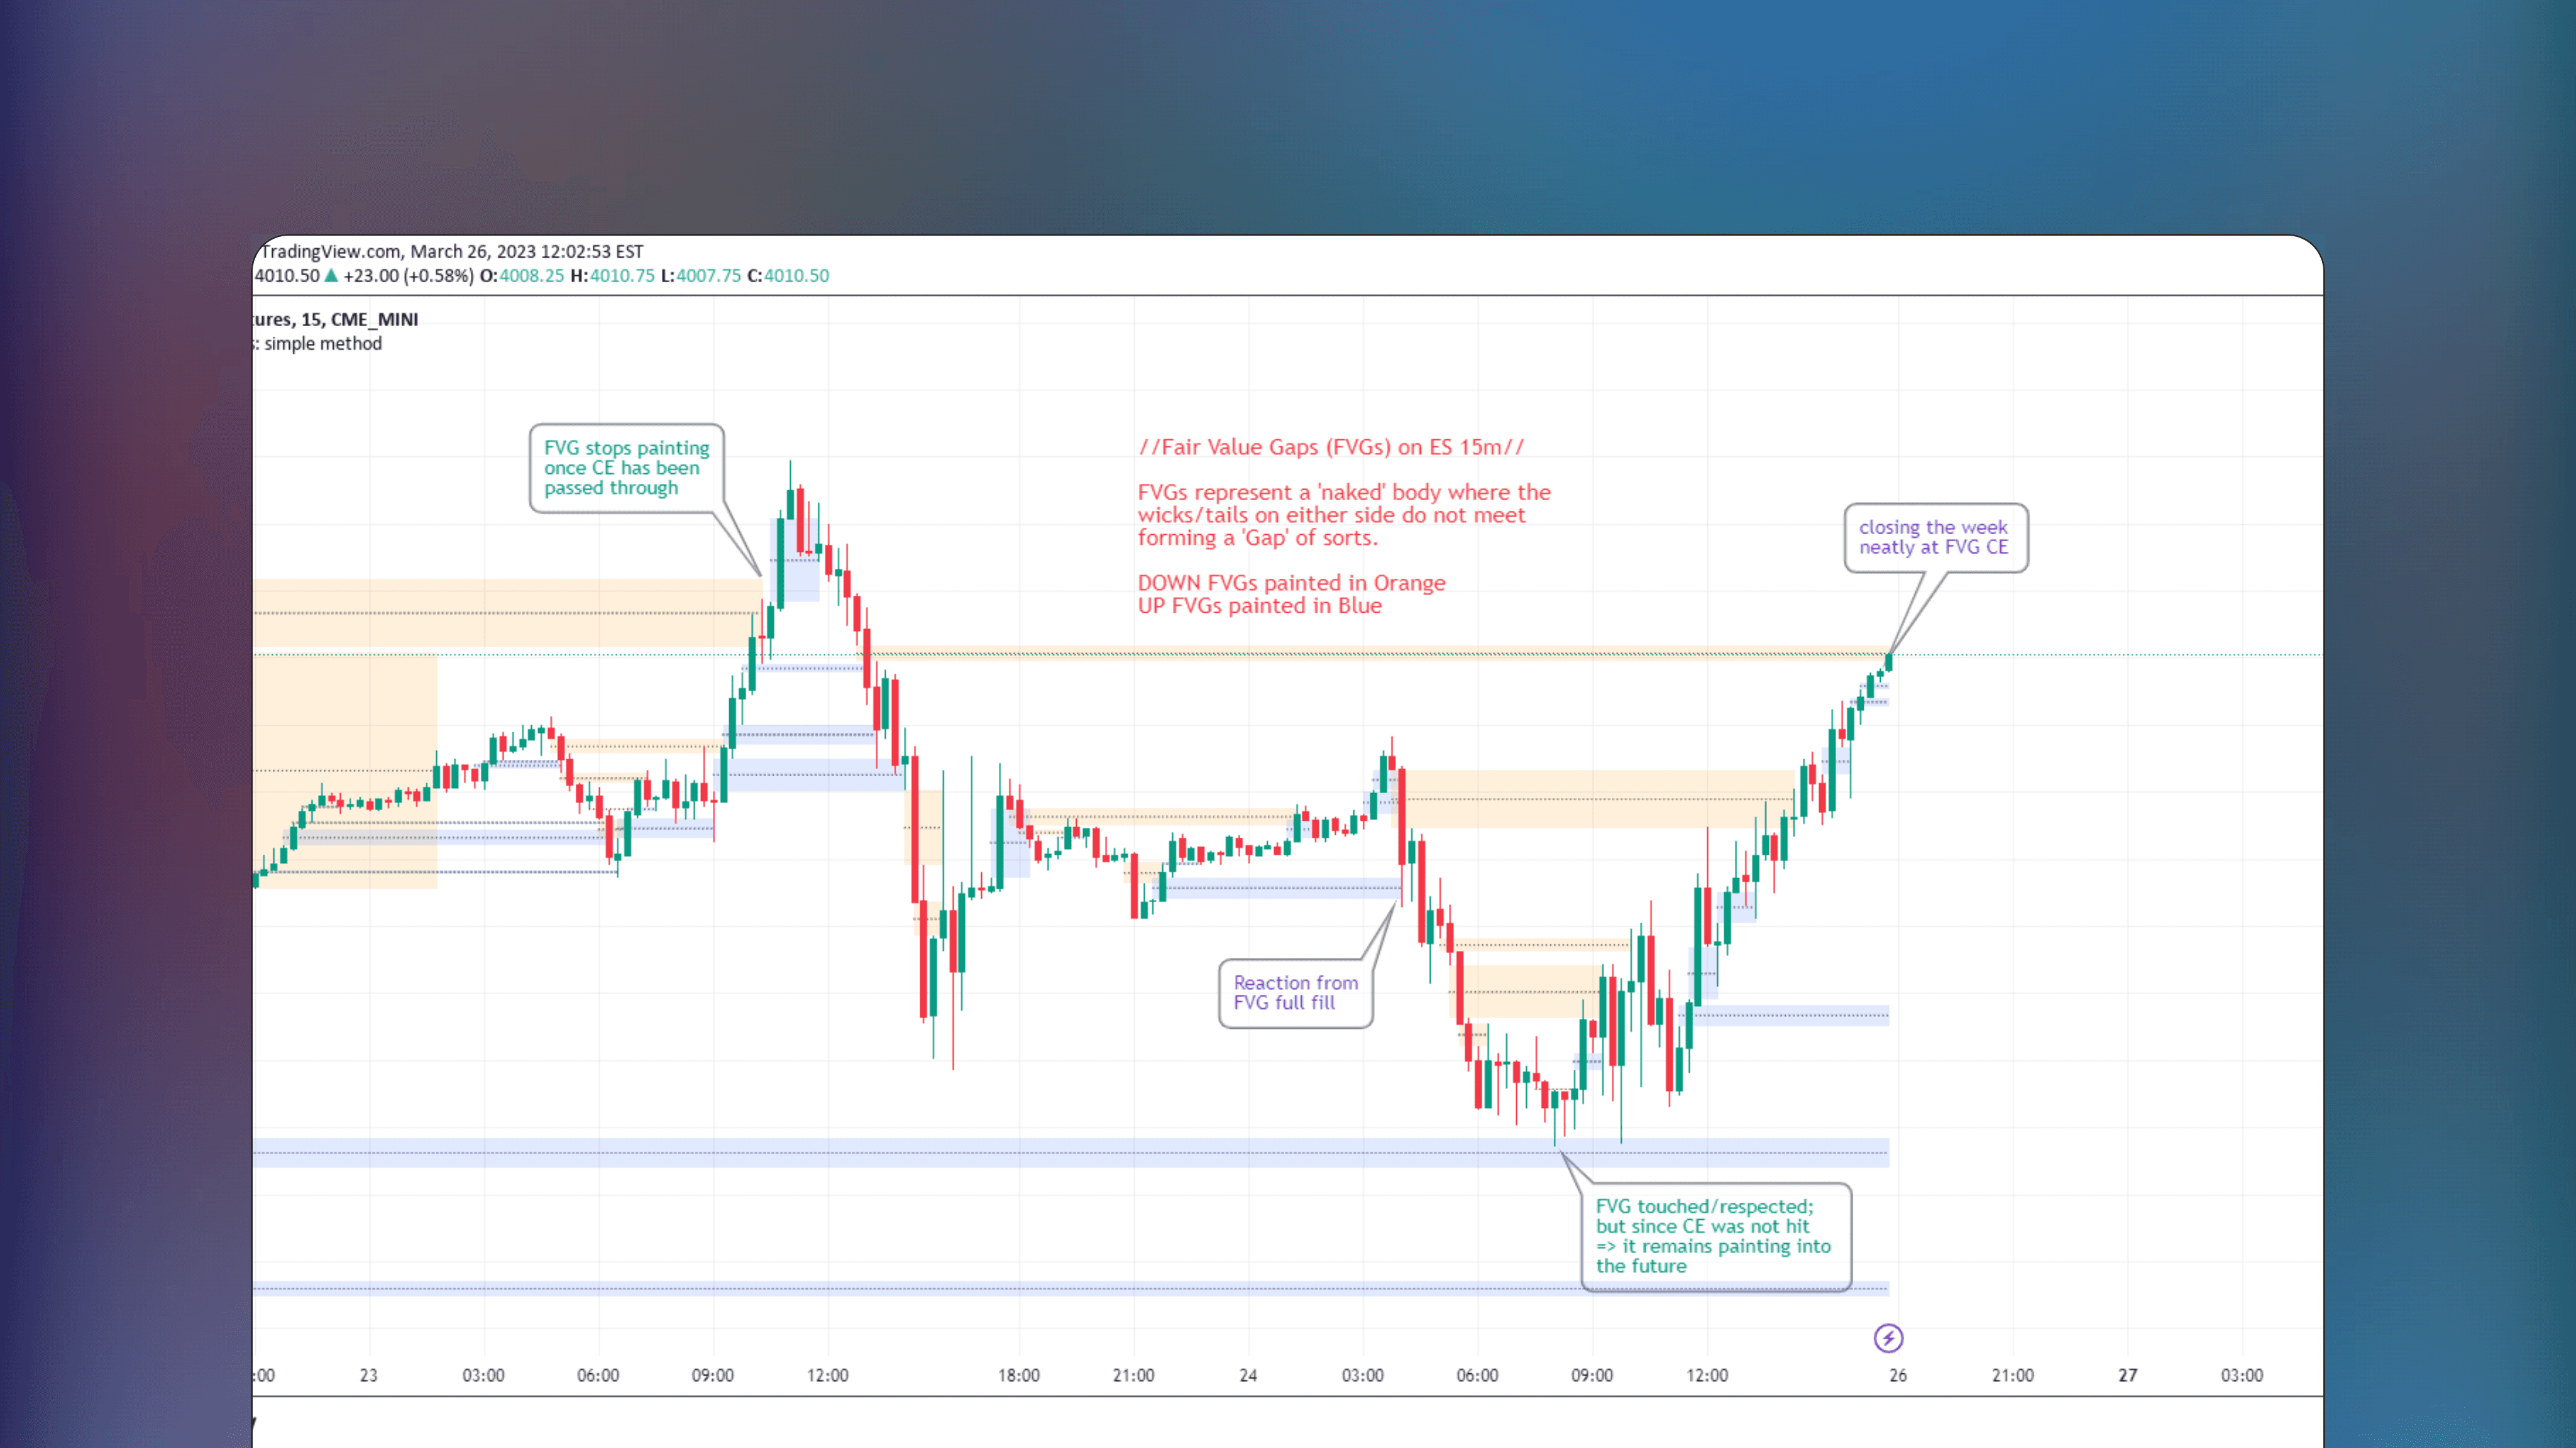
FVGs & CEs + Alerts is a TradingView indicator that identifies and marks Fair Value Gaps and their midlines. Fair Value Gaps are not displayed when conditions like hitting a CE or fully filling the gap are met, decreasing clutter. Includes alerts for fills.
🤖
by benten
Free
ThinkOrSwim Indicator
Triple VWAP Indicator For ThinkOrSwim
New
🔑
✅
Triple VWAP Indicator for ThinkorSwim VWAP by adding 1 to 3 standard deviation bands alongside VWAP, providing a more detailed view of extreme deviations based on market volatility.
🤖
by scriptor
Free
MetaTrader Indicator
Volume_Accumulation
New
🔑
🌐
Volume_Accumulation is a MetaTrader Indicator that displays volume accumulation and distribution using a specialized formula. The indicator requires no inputs or settings, simply start using.
Load More
🤖
Similar Listings
Traders also viewed
All


🤖
by LeviathanCapital
Free
TradingView Indicator
Multi-Asset Performance [Spaghetti] - By Leviathan
🔑
✅
🏅
Multi-Asset Performance [Spaghetti] by Leviathan is a TradingView Indicator that visualizes cumulative percentage changes of up to 30 assets over a specified period, providing tools and analytics for analyzing outperforming assets and rotations.

🤖
by LeviathanCapital
Free
TradingView Indicator
Market Sessions - By Leviathan
🔑
🌐
✅
🏅
Market Sessions – By Leviathan is a TradingView indicator that visualizes the Tokyo, London, New York, and Sydney sessions using discreet boxes and colored candles, along with additional tools for tracking crucial market sessions.
🤖
by LeviathanCapital
Free
TradingView Indicator
Range Analysis - By Leviathan
🔑
🌐
✅
🏅
Range Analysis - By Leviathan is a free TradingView indicator that automates price range analysis by identifying key support and resistance levels. Draw range levels, generate Volume or Open Interest profiles, display heatmaps, plot anchored VWAP and Fibonacci retracement levels, automatically.
🤖
by iravan
Free
TradingView Indicator
Dynamic Linear Regression Channels
🔑
✅
Dynamic Linear Regression Channels is a TradingView Indicator that calculates linear regression channels based on real-time price movements, generating new support/resistance channels when previous ones are broken.

🤖
by KioseffTrading
Free
TradingView Indicator
Sync Frame (MTF Charts) [Kioseff Trading]
🔑
🌐
🏅
Sync Frame (MTF Charts) [Kioseff Trading] is a free TradingView indicator that allows users to view multiple lower timeframe charts for any asset simultaneously, in various formats, on a single screen.
🤖
by LeviathanCapital
Free
TradingView Indicator
Gaps + Imbalances + Wicks (MTF) - By Leviathan
🔑
🌐
✅
Gaps + Imbalances + Wicks (MTF) by Leviathan detects and displays price gaps in various forms - imbalances, gaps and inefficient wicks. This TradingView Indicator features customizable fill conditions, zone size filtering, volume comparison, lookback filtering and customizable visuals.

🤖
by MXWLL-Capital-Trading
Free
TradingView Indicator
Mxwll Price Action Suite [Mxwll]
🔑
🌐
✅
🏅
Mxwll Price Action Suite is a TradingView indicator that combines multiple ICT and Smart Money Concepts with unique methodologies into an all-in-one price action toolkit.
🤖
by tradeforopp
Free
TradingView Indicator
TTrades Daily Bias [TFO]
🔑
🌐
TTrades Daily Bias [TFO] is a TradingView indicator that determines market bias by analyzing previous highs and lows on daily and weekly timeframes, tracking success rates based on successful follow-through in price action.
🤖
by sbtnc
Free
TradingView Indicator
Time of Day - Volatility Report
🔑
🌐
✅
Time of Day - Volatility Report is a TradingView indicator that analyzes market volatility at time by providing statistics on average hourly market fluctuations.
🤖
by tradeforopp
Free
TradingView Indicator
ICT Killzones + Pivots [TFO]
🔑
🌐
ICT Killzones + Pivots [TFO] is a TradingView indicator that highlights and monitors trading session highs and lows, coined as kill zones by ICT traders.
🤖
by anche1991
Free
TradingView Indicator
Fair Value Gap by Anche
🔑
🌐
✅
Fair Value Gap by Anche is a TradingView indicator that identifies and plots fair value gaps caused by significant order imbalances. The indicator highlights areas where price may later move to resolve the inefficiency.
🤖
by makuchaku
Free
TradingView Indicator
Makuchaku's trading tools - Liquidity visualizer
🔑
🏅
Makuchaku's Trading Tools – Liquidity visualizer is a TradingView indicator that plots untouched pivots and fractals not yet breached by price, highlighting highs and lows where stop orders or liquidity may reside.

🤖
by spacemanbtc
Free
TradingView Indicator
Key Levels SpacemanBTC IDWM
🔑
✅
🏅
Key Levels SpacemanBTC IDWM is a TradingView indicator that automatically plots classical price action key levels with multi-timeframe.

🤖
by tradeforopp
Free
TradingView Indicator
Market Structure [TFO]
🔑
🌐
✅
🏅
Market Structure [TFO] is a TradingView indicator that identifies market trends by analyzing price closes relative to previous swing highs and lows, a concept popular among ICT and price action traders.

🤖
by tradeforopp
Free
TradingView Indicator
Opening Range Gaps [TFO]
🔑
🌐
🏅
Opening Range Gaps [TFO] is a TradingView indicator that highlights gaps between the previous day’s close and today’s open with colors showing if the open is above or below the prior close.
🤖
by tradeforopp
Free
TradingView Indicator
Range Projections [TFO]
🔑
🌐
🏅
Range Projections [TFO] is a free TradingView indicator that visualizes how often prices reach specific standard deviations within a selected time range. By default based on ICT’s Central Bank Dealers Range (2–8 pm NY time) but can be applied to any timeframe.

🤖
by ChartPrime
Free
TradingView Indicator
Bollinger Bands Liquidity Cloud [ChartPrime]
🔑
🌐
🏅
Bollinger Bands Liquidity Cloud [ChartPrime] is a TradingView indicator that expands Bollinger Bands with a heatmap showing traded volume at each price, based on similar calculations used in a volume profile.
🤖
by spacemanbtc
Free
TradingView Indicator
Fair Value Gap
🔑
🌐
✅
🏅
Fair Value Gap is a TradingView indicator that identifies fair value gaps across various timeframes, showing gaps on both current and higher timeframes. Can be used for gauging areas that are likely to fill sooner or later.

🤖
by Lenny_Kiruthu
Free
TradingView Indicator
MTF Break of Structure(BOS) & Market Structure Shift(MSS)
🔑
🌐
MTF Break of Structure (BOS) & Market Structure Shift (MSS) is a TradingView indicator that detects key market structure shifts and breaks across multiple, customizable timeframes.
🤖
by spudow
Free
TradingView Indicator
Extreme Entry with Mean Reversion and Trend Filter
🔑
🌐
Extreme Entry with Mean Reversion and Trend Filter is a TradingView indicator that uses mean reversion, trend filtering, RSI levels, divergence, and momentum oscillators like CCI or MOM to provide long and short signals with high amount of stacked confluence.

🤖
by TheTradingParrot
Free
TradingView Indicator
TTP VIX Spy
🔑
🌐
🏅
TTP VIX Spy is a TradingView indicator using VIX volatility data to detect points in price with extreme greed and fear.
🤖
by loxx
Free
TradingView Indicator
STD-Filtered Jurik Volty Adaptive TEMA [Loxx]
🔑
🏅
The STD-Filtered Jurik Volty Adaptive TEMA [Loxx] Indicator integrates adaptive Jurik Volty periods into a Triple Exponential Moving Average with various statistical methods to reduce noise, resulting a in a less lagging and more responsive moving average.
🤖
by TheTradingParrot
Free
TradingView Indicator
TTP Breaking Point
🔑
🌐
🏅
TTP Breaking Point is a TradingView indicator that uses ratio of Bitcoin longs and shorts to forecast Bitcoin market tops and bottoms, aiming to provide optimal entry and exit signals.

🤖
by jdehorty
Free
TradingView Indicator
Nadaraya-Watson: Envelope (Non-Repainting)
🔑
✅
🏅
Nadaraya-Watson: Envelope (Non-Repainting) is a free TradingView Indicator that calculates Nadaraya-Watson envelopes using a non-repainting method, allowing a reliable identification of levels with extreme price deviations.
🤖
by Zeiierman
Free
TradingView Indicator
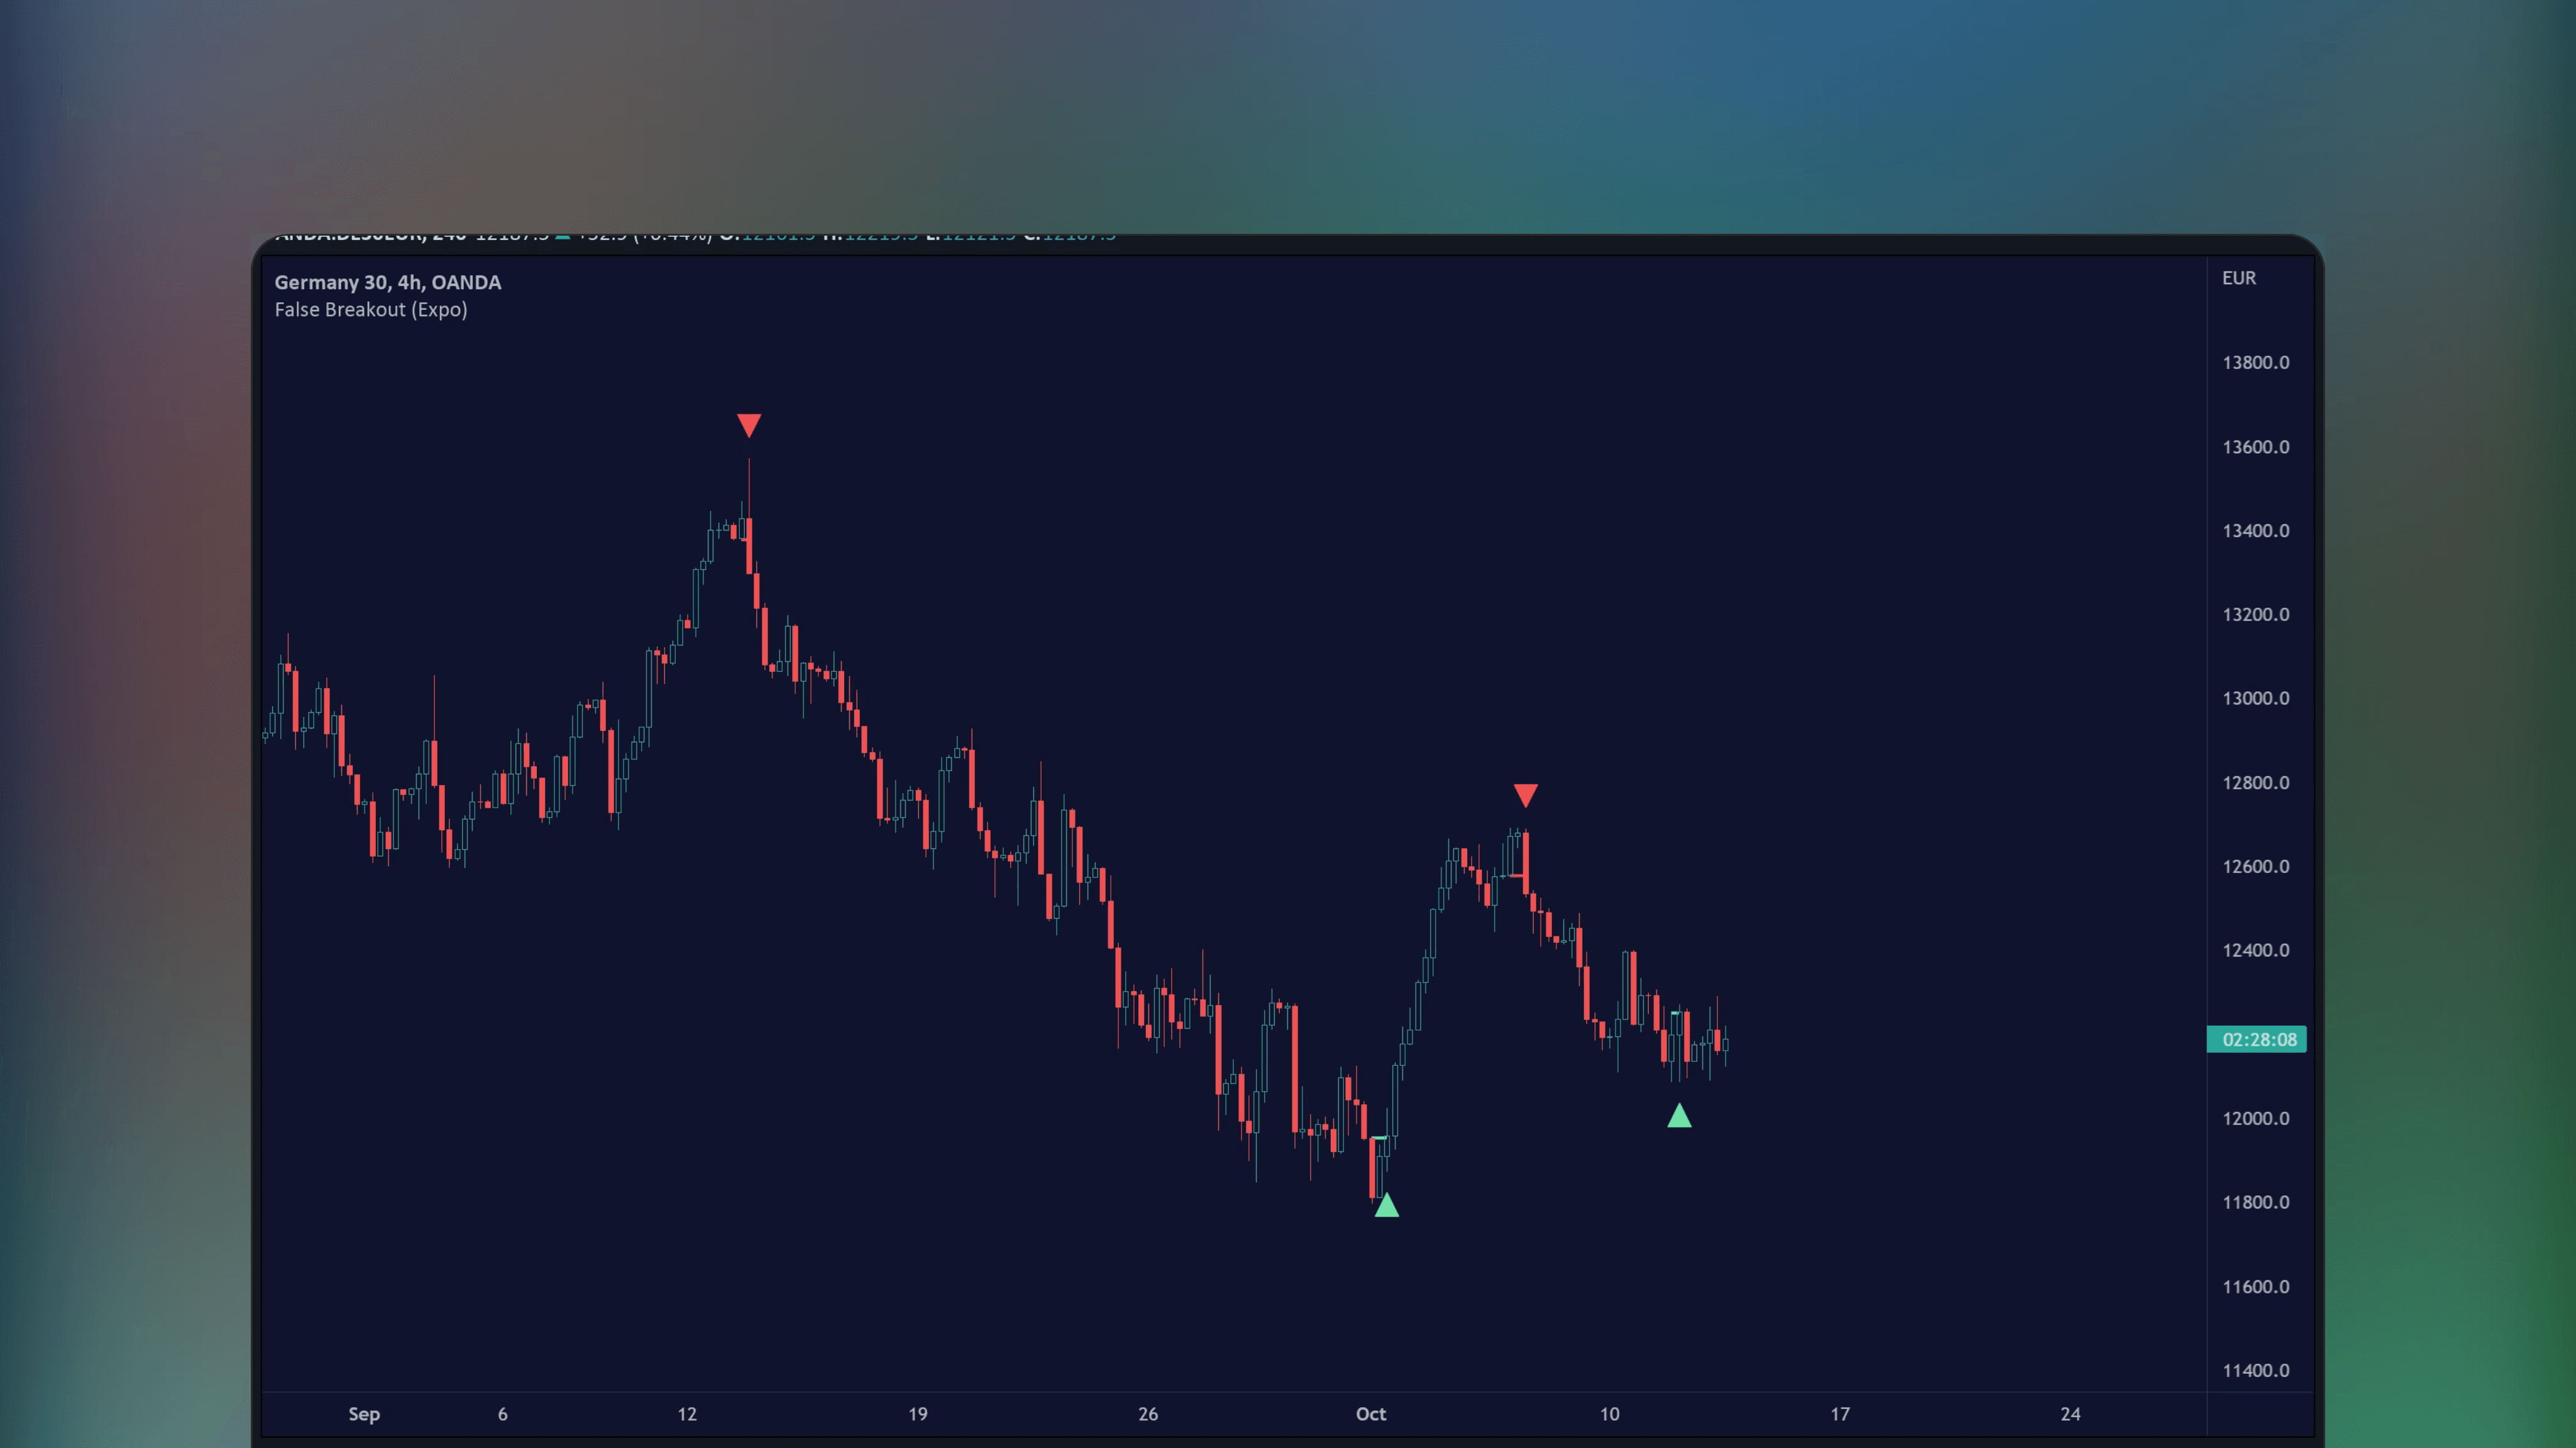
False Breakout (Expo)
🔑
🌐
🏅
False Breakout (Expo) is a TradingView price action indicator that detects real-time false breakouts by tracking key levels that are exceeded by price and then closed back inside the level.
🤖
by tradeforopp
Free
TradingView Indicator
Balanced Price Range (BPR)
🔑
🏅
Balanced Price Range (BPR) is a TradingView Indicator that detects overlapping bullish and bearish Fair Value Gaps, also known as double FVGs.

🤖
by loxx
Free
TradingView Indicator
Levinson-Durbin Autocorrelation Extrapolation of Price [Loxx]
🔑
🏅
Levinson-Durbin Autocorrelation Extrapolation of Price [Loxx] is a TradingView indicator that uses the Levinson-Durbin recursion algorithm to forecast future price trends based on historical price data.

🤖
by Arun_K_Bhaskar
Free
TradingView Indicator
Average Daily Range (ADR) (Multi Timeframe, Multi Period)
🔑
🌐
Average Daily Range (ADR) (Multi Timeframe, Multi Period) is a TradingView indicator that calculates the average daily price range across various timeframes, used to calculate key levels, extreme price levels and potential breakouts.
🤖
by loxx
Free
TradingView Indicator
Fourier Extrapolator of Price w/ Projection Forecast [Loxx]
🔑
🏅
Fourier Extrapolator of Price w/ Projection Forecast [Loxx] is a TradingView indicator that projects future price trends using a multi-harmonic trigonometric model based on historical data.
🤖
by EmreKb
Free
TradingView Indicator
Market Structure Break & Order Block by EmreKb
🔑
🌐
🏅
Market Structure Break & Order Block by EmreKb is a TradingView indicator that automatically identifies market structure breaks and orderblocks, considered to be key events in ICT and price action trading.
🤖
by LeviathanCapital
Free
TradingView Indicator
Multi-Asset Performance [Spaghetti] - By Leviathan
🔑
✅
🏅
Multi-Asset Performance [Spaghetti] by Leviathan is a TradingView Indicator that visualizes cumulative percentage changes of up to 30 assets over a specified period, providing tools and analytics for analyzing outperforming assets and rotations.
🤖
by LeviathanCapital
Free
TradingView Indicator
Market Sessions - By Leviathan
🔑
🌐
✅
🏅
Market Sessions – By Leviathan is a TradingView indicator that visualizes the Tokyo, London, New York, and Sydney sessions using discreet boxes and colored candles, along with additional tools for tracking crucial market sessions.
🤖
by LeviathanCapital
Free
TradingView Indicator
Range Analysis - By Leviathan
🔑
🌐
✅
🏅
Range Analysis - By Leviathan is a free TradingView indicator that automates price range analysis by identifying key support and resistance levels. Draw range levels, generate Volume or Open Interest profiles, display heatmaps, plot anchored VWAP and Fibonacci retracement levels, automatically.
🤖
by iravan
Free
TradingView Indicator
Dynamic Linear Regression Channels
🔑
✅
Dynamic Linear Regression Channels is a TradingView Indicator that calculates linear regression channels based on real-time price movements, generating new support/resistance channels when previous ones are broken.
🤖
by KioseffTrading
Free
TradingView Indicator
Sync Frame (MTF Charts) [Kioseff Trading]
🔑
🌐
🏅
Sync Frame (MTF Charts) [Kioseff Trading] is a free TradingView indicator that allows users to view multiple lower timeframe charts for any asset simultaneously, in various formats, on a single screen.
🤖
by LeviathanCapital
Free
TradingView Indicator
Gaps + Imbalances + Wicks (MTF) - By Leviathan
🔑
🌐
✅
Gaps + Imbalances + Wicks (MTF) by Leviathan detects and displays price gaps in various forms - imbalances, gaps and inefficient wicks. This TradingView Indicator features customizable fill conditions, zone size filtering, volume comparison, lookback filtering and customizable visuals.
🤖
by MXWLL-Capital-Trading
Free
TradingView Indicator
Mxwll Price Action Suite [Mxwll]
🔑
🌐
✅
🏅
Mxwll Price Action Suite is a TradingView indicator that combines multiple ICT and Smart Money Concepts with unique methodologies into an all-in-one price action toolkit.
🤖
by tradeforopp
Free
TradingView Indicator
TTrades Daily Bias [TFO]
🔑
🌐
TTrades Daily Bias [TFO] is a TradingView indicator that determines market bias by analyzing previous highs and lows on daily and weekly timeframes, tracking success rates based on successful follow-through in price action.
🤖
by sbtnc
Free
TradingView Indicator
Time of Day - Volatility Report
🔑
🌐
✅
Time of Day - Volatility Report is a TradingView indicator that analyzes market volatility at time by providing statistics on average hourly market fluctuations.
🤖
by tradeforopp
Free
TradingView Indicator
ICT Killzones + Pivots [TFO]
🔑
🌐
ICT Killzones + Pivots [TFO] is a TradingView indicator that highlights and monitors trading session highs and lows, coined as kill zones by ICT traders.
🤖
by anche1991
Free
TradingView Indicator
Fair Value Gap by Anche
🔑
🌐
✅
Fair Value Gap by Anche is a TradingView indicator that identifies and plots fair value gaps caused by significant order imbalances. The indicator highlights areas where price may later move to resolve the inefficiency.
🤖
by makuchaku
Free
TradingView Indicator
Makuchaku's trading tools - Liquidity visualizer
🔑
🏅
Makuchaku's Trading Tools – Liquidity visualizer is a TradingView indicator that plots untouched pivots and fractals not yet breached by price, highlighting highs and lows where stop orders or liquidity may reside.
🤖
by spacemanbtc
Free
TradingView Indicator
Key Levels SpacemanBTC IDWM
🔑
✅
🏅
Key Levels SpacemanBTC IDWM is a TradingView indicator that automatically plots classical price action key levels with multi-timeframe.
🤖
by tradeforopp
Free
TradingView Indicator
Market Structure [TFO]
🔑
🌐
✅
🏅
Market Structure [TFO] is a TradingView indicator that identifies market trends by analyzing price closes relative to previous swing highs and lows, a concept popular among ICT and price action traders.
🤖
by tradeforopp
Free
TradingView Indicator
Opening Range Gaps [TFO]
🔑
🌐
🏅
Opening Range Gaps [TFO] is a TradingView indicator that highlights gaps between the previous day’s close and today’s open with colors showing if the open is above or below the prior close.
🤖
by tradeforopp
Free
TradingView Indicator
Range Projections [TFO]
🔑
🌐
🏅
Range Projections [TFO] is a free TradingView indicator that visualizes how often prices reach specific standard deviations within a selected time range. By default based on ICT’s Central Bank Dealers Range (2–8 pm NY time) but can be applied to any timeframe.
🤖
by ChartPrime
Free
TradingView Indicator
Bollinger Bands Liquidity Cloud [ChartPrime]
🔑
🌐
🏅
Bollinger Bands Liquidity Cloud [ChartPrime] is a TradingView indicator that expands Bollinger Bands with a heatmap showing traded volume at each price, based on similar calculations used in a volume profile.
🤖
by spacemanbtc
Free
TradingView Indicator
Fair Value Gap
🔑
🌐
✅
🏅
Fair Value Gap is a TradingView indicator that identifies fair value gaps across various timeframes, showing gaps on both current and higher timeframes. Can be used for gauging areas that are likely to fill sooner or later.
🤖
by Lenny_Kiruthu
Free
TradingView Indicator
MTF Break of Structure(BOS) & Market Structure Shift(MSS)
🔑
🌐
MTF Break of Structure (BOS) & Market Structure Shift (MSS) is a TradingView indicator that detects key market structure shifts and breaks across multiple, customizable timeframes.
🤖
by spudow
Free
TradingView Indicator
Extreme Entry with Mean Reversion and Trend Filter
🔑
🌐
Extreme Entry with Mean Reversion and Trend Filter is a TradingView indicator that uses mean reversion, trend filtering, RSI levels, divergence, and momentum oscillators like CCI or MOM to provide long and short signals with high amount of stacked confluence.
🤖
by LeviathanCapital
Free
TradingView Indicator
Multi-Asset Performance [Spaghetti] - By Leviathan
🔑
✅
🏅
Multi-Asset Performance [Spaghetti] by Leviathan is a TradingView Indicator that visualizes cumulative percentage changes of up to 30 assets over a specified period, providing tools and analytics for analyzing outperforming assets and rotations.
🤖
by LeviathanCapital
Free
TradingView Indicator
Market Sessions - By Leviathan
🔑
🌐
✅
🏅
Market Sessions – By Leviathan is a TradingView indicator that visualizes the Tokyo, London, New York, and Sydney sessions using discreet boxes and colored candles, along with additional tools for tracking crucial market sessions.
🤖
by LeviathanCapital
Free
TradingView Indicator
Range Analysis - By Leviathan
🔑
🌐
✅
🏅
Range Analysis - By Leviathan is a free TradingView indicator that automates price range analysis by identifying key support and resistance levels. Draw range levels, generate Volume or Open Interest profiles, display heatmaps, plot anchored VWAP and Fibonacci retracement levels, automatically.
🤖
by iravan
Free
TradingView Indicator
Dynamic Linear Regression Channels
🔑
✅
Dynamic Linear Regression Channels is a TradingView Indicator that calculates linear regression channels based on real-time price movements, generating new support/resistance channels when previous ones are broken.
🤖
by KioseffTrading
Free
TradingView Indicator
Sync Frame (MTF Charts) [Kioseff Trading]
🔑
🌐
🏅
Sync Frame (MTF Charts) [Kioseff Trading] is a free TradingView indicator that allows users to view multiple lower timeframe charts for any asset simultaneously, in various formats, on a single screen.
🤖
by LeviathanCapital
Free
TradingView Indicator
Gaps + Imbalances + Wicks (MTF) - By Leviathan
🔑
🌐
✅
Gaps + Imbalances + Wicks (MTF) by Leviathan detects and displays price gaps in various forms - imbalances, gaps and inefficient wicks. This TradingView Indicator features customizable fill conditions, zone size filtering, volume comparison, lookback filtering and customizable visuals.
🤖
by MXWLL-Capital-Trading
Free
TradingView Indicator
Mxwll Price Action Suite [Mxwll]
🔑
🌐
✅
🏅
Mxwll Price Action Suite is a TradingView indicator that combines multiple ICT and Smart Money Concepts with unique methodologies into an all-in-one price action toolkit.
🤖
by tradeforopp
Free
TradingView Indicator
TTrades Daily Bias [TFO]
🔑
🌐
TTrades Daily Bias [TFO] is a TradingView indicator that determines market bias by analyzing previous highs and lows on daily and weekly timeframes, tracking success rates based on successful follow-through in price action.
🤖
by sbtnc
Free
TradingView Indicator
Time of Day - Volatility Report
🔑
🌐
✅
Time of Day - Volatility Report is a TradingView indicator that analyzes market volatility at time by providing statistics on average hourly market fluctuations.
🤖
by tradeforopp
Free
TradingView Indicator
ICT Killzones + Pivots [TFO]
🔑
🌐
ICT Killzones + Pivots [TFO] is a TradingView indicator that highlights and monitors trading session highs and lows, coined as kill zones by ICT traders.
Discover trading edge
Discover trading edge
Indicators, Platforms & Education
Indicators, Platforms & Education
TradersList
Discover trading edge
Join Telegram
Weekly listings
Join Telegram
Disclaimer
Our goal is to achieve greater transparency, guidance and safety in trading and investing by providing means to discover, research and discuss trading/investing related sites/services.
Content provided on this site is not financial advice, meant for educational purposes only. TradersList does not endorse or guarantee any result for listed sites/services. Do your own research.
Read full disclaimer
TradersList
Discover trading edge
Join Telegram
Disclaimer
Our goal is to achieve greater transparency, guidance and safety in trading and investing by providing means to discover, research and discuss trading/investing related sites/services.
Content provided on this site is not financial advice, meant for educational purposes only. TradersList does not endorse or guarantee any result for listed sites/services. Do your own research.
Read full disclaimer