

From TradersList Editors
From TradersList Editors
Gain comprehensive market insights by using this indicator to intuitively visualize and analyze buy and sell volumes for enhanced trading decisions.
Gain comprehensive market insights by using this indicator to intuitively visualize and analyze buy and sell volumes for enhanced trading decisions.


NinjaTrader Indicator
NinjaTrader Indicator
Depth of Market (DOM) using this Free NinjaTrader Indicator
Depth of Market (DOM) using this Free NinjaTrader Indicator
by NinjaTrader_PatrickH on NinjaTrader
by NinjaTrader_PatrickH on NinjaTrader
by NinjaTrader_PatrickH on NinjaTrader
🤖
Bi-Directional Buy Sell Volume Super DOM Column
Bi-Directional Buy Sell Volume Super DOM Column
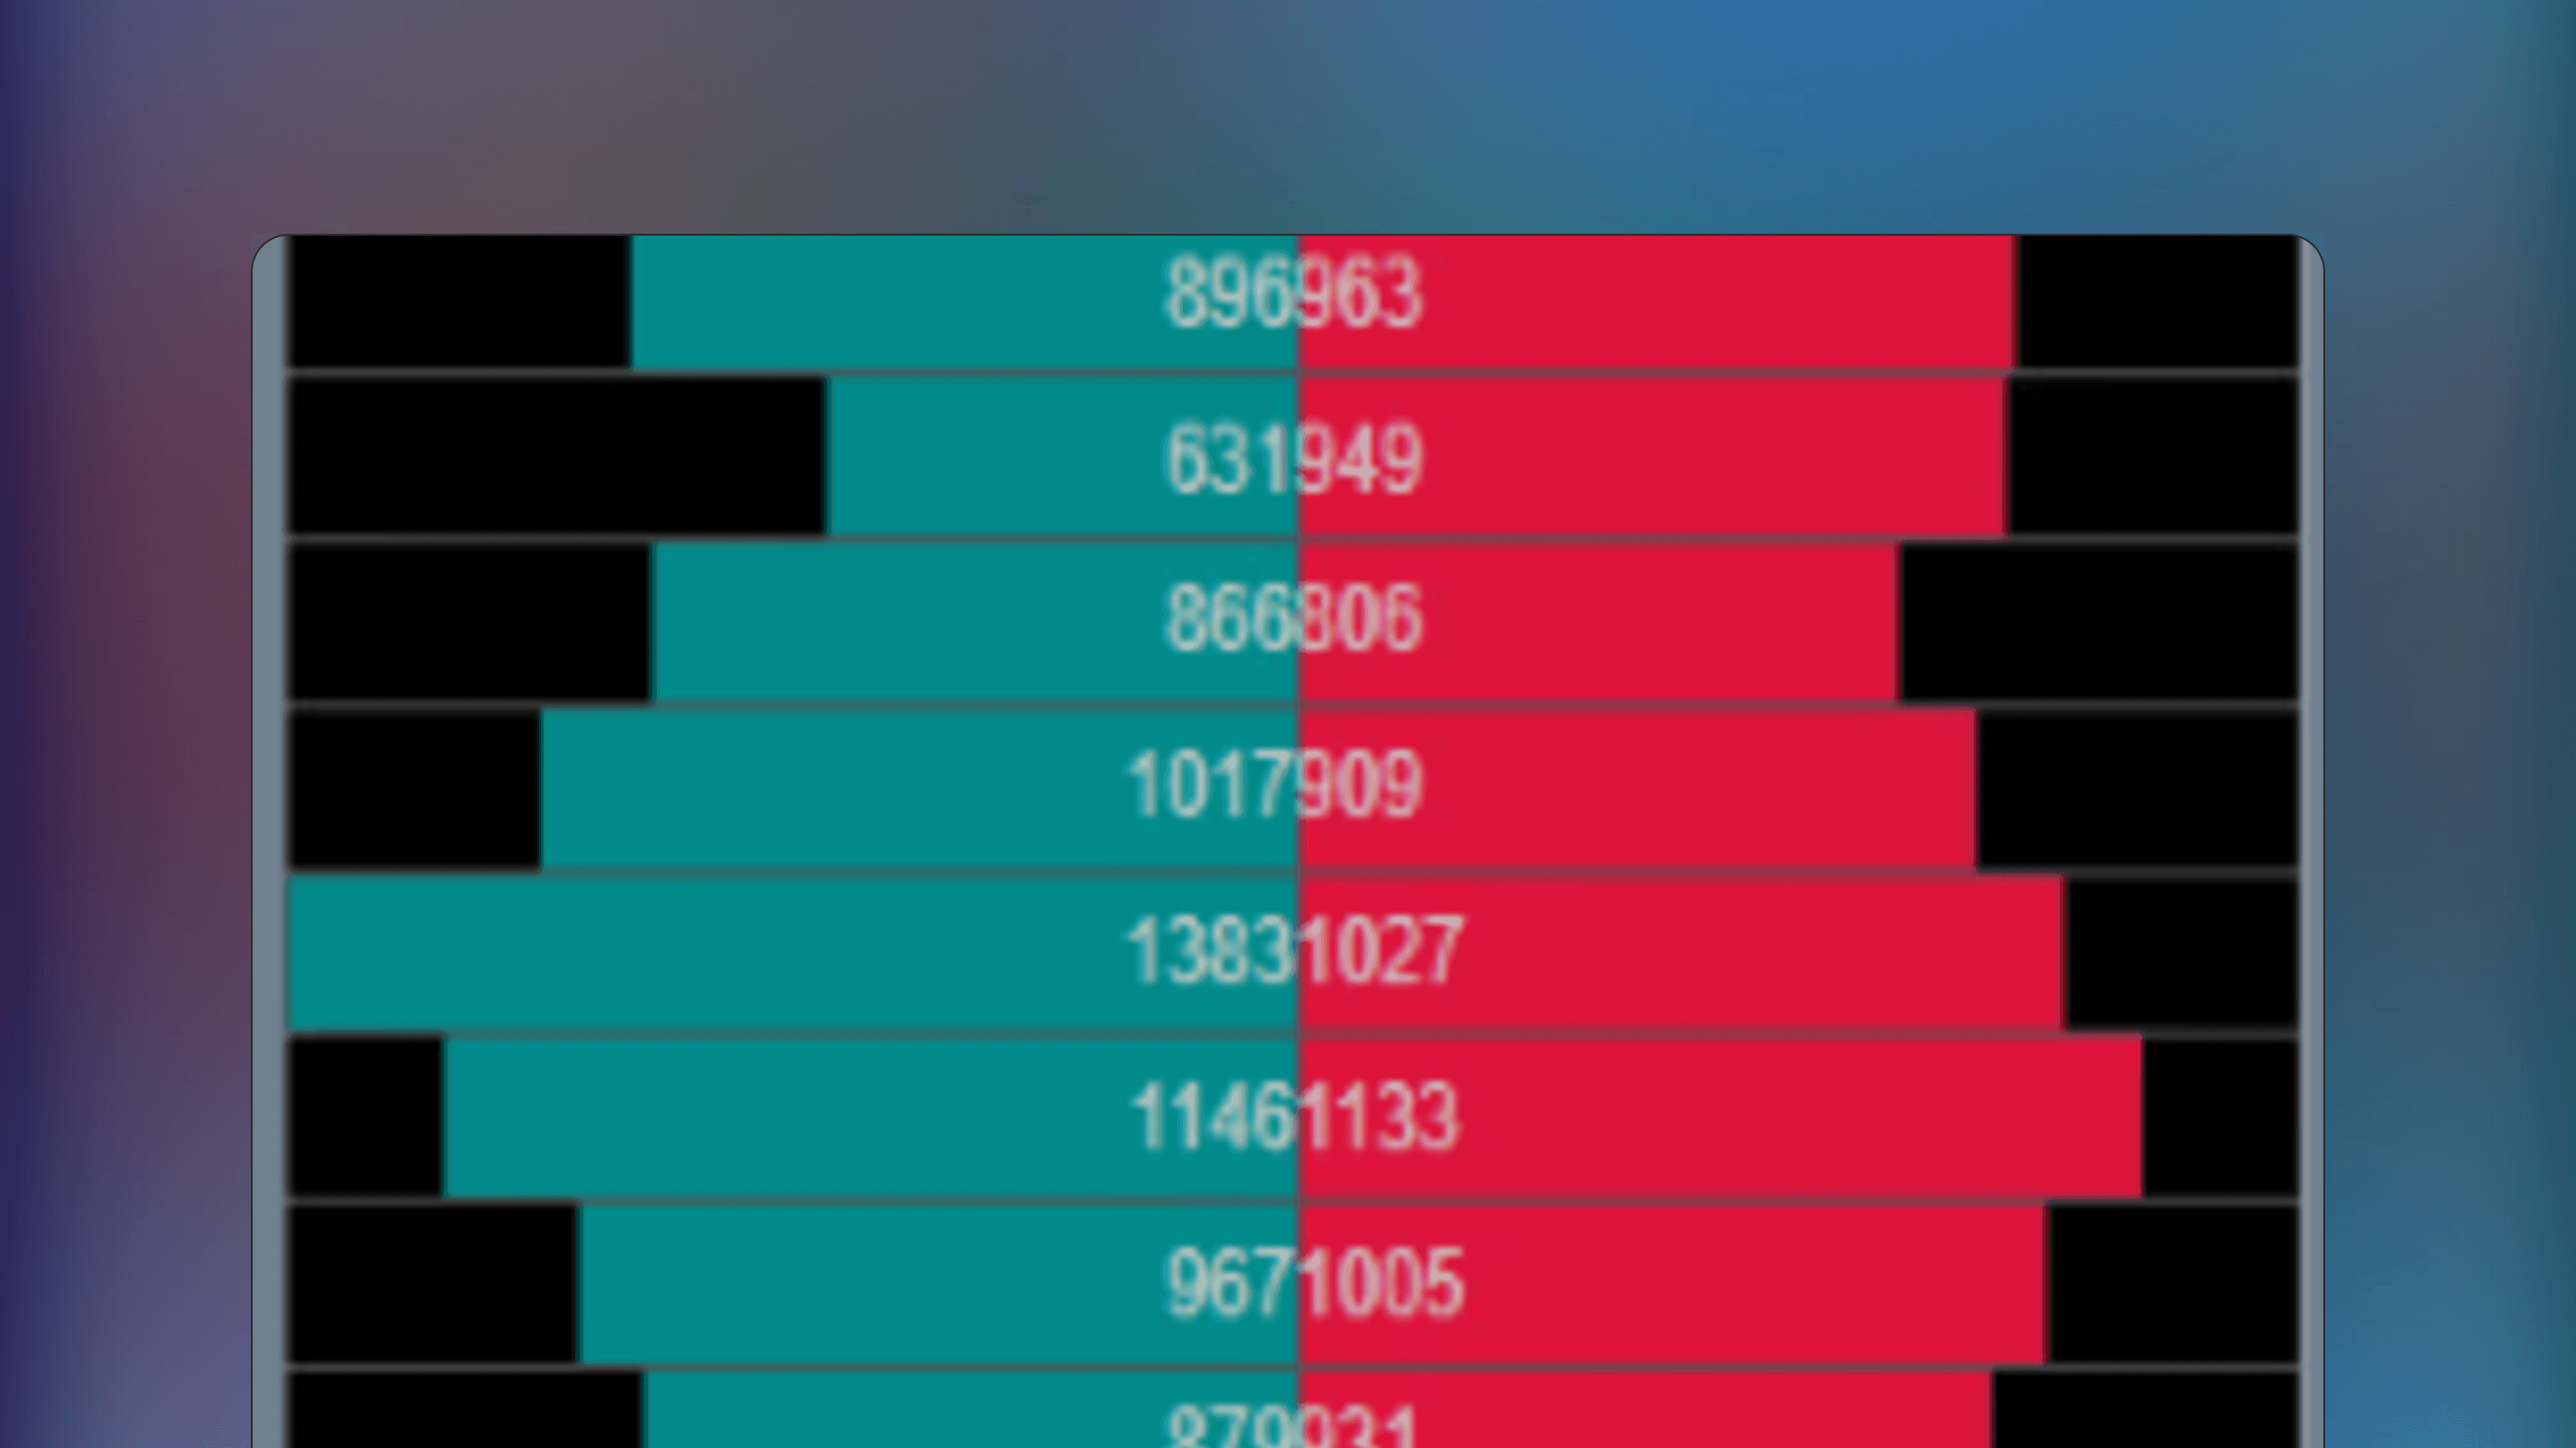
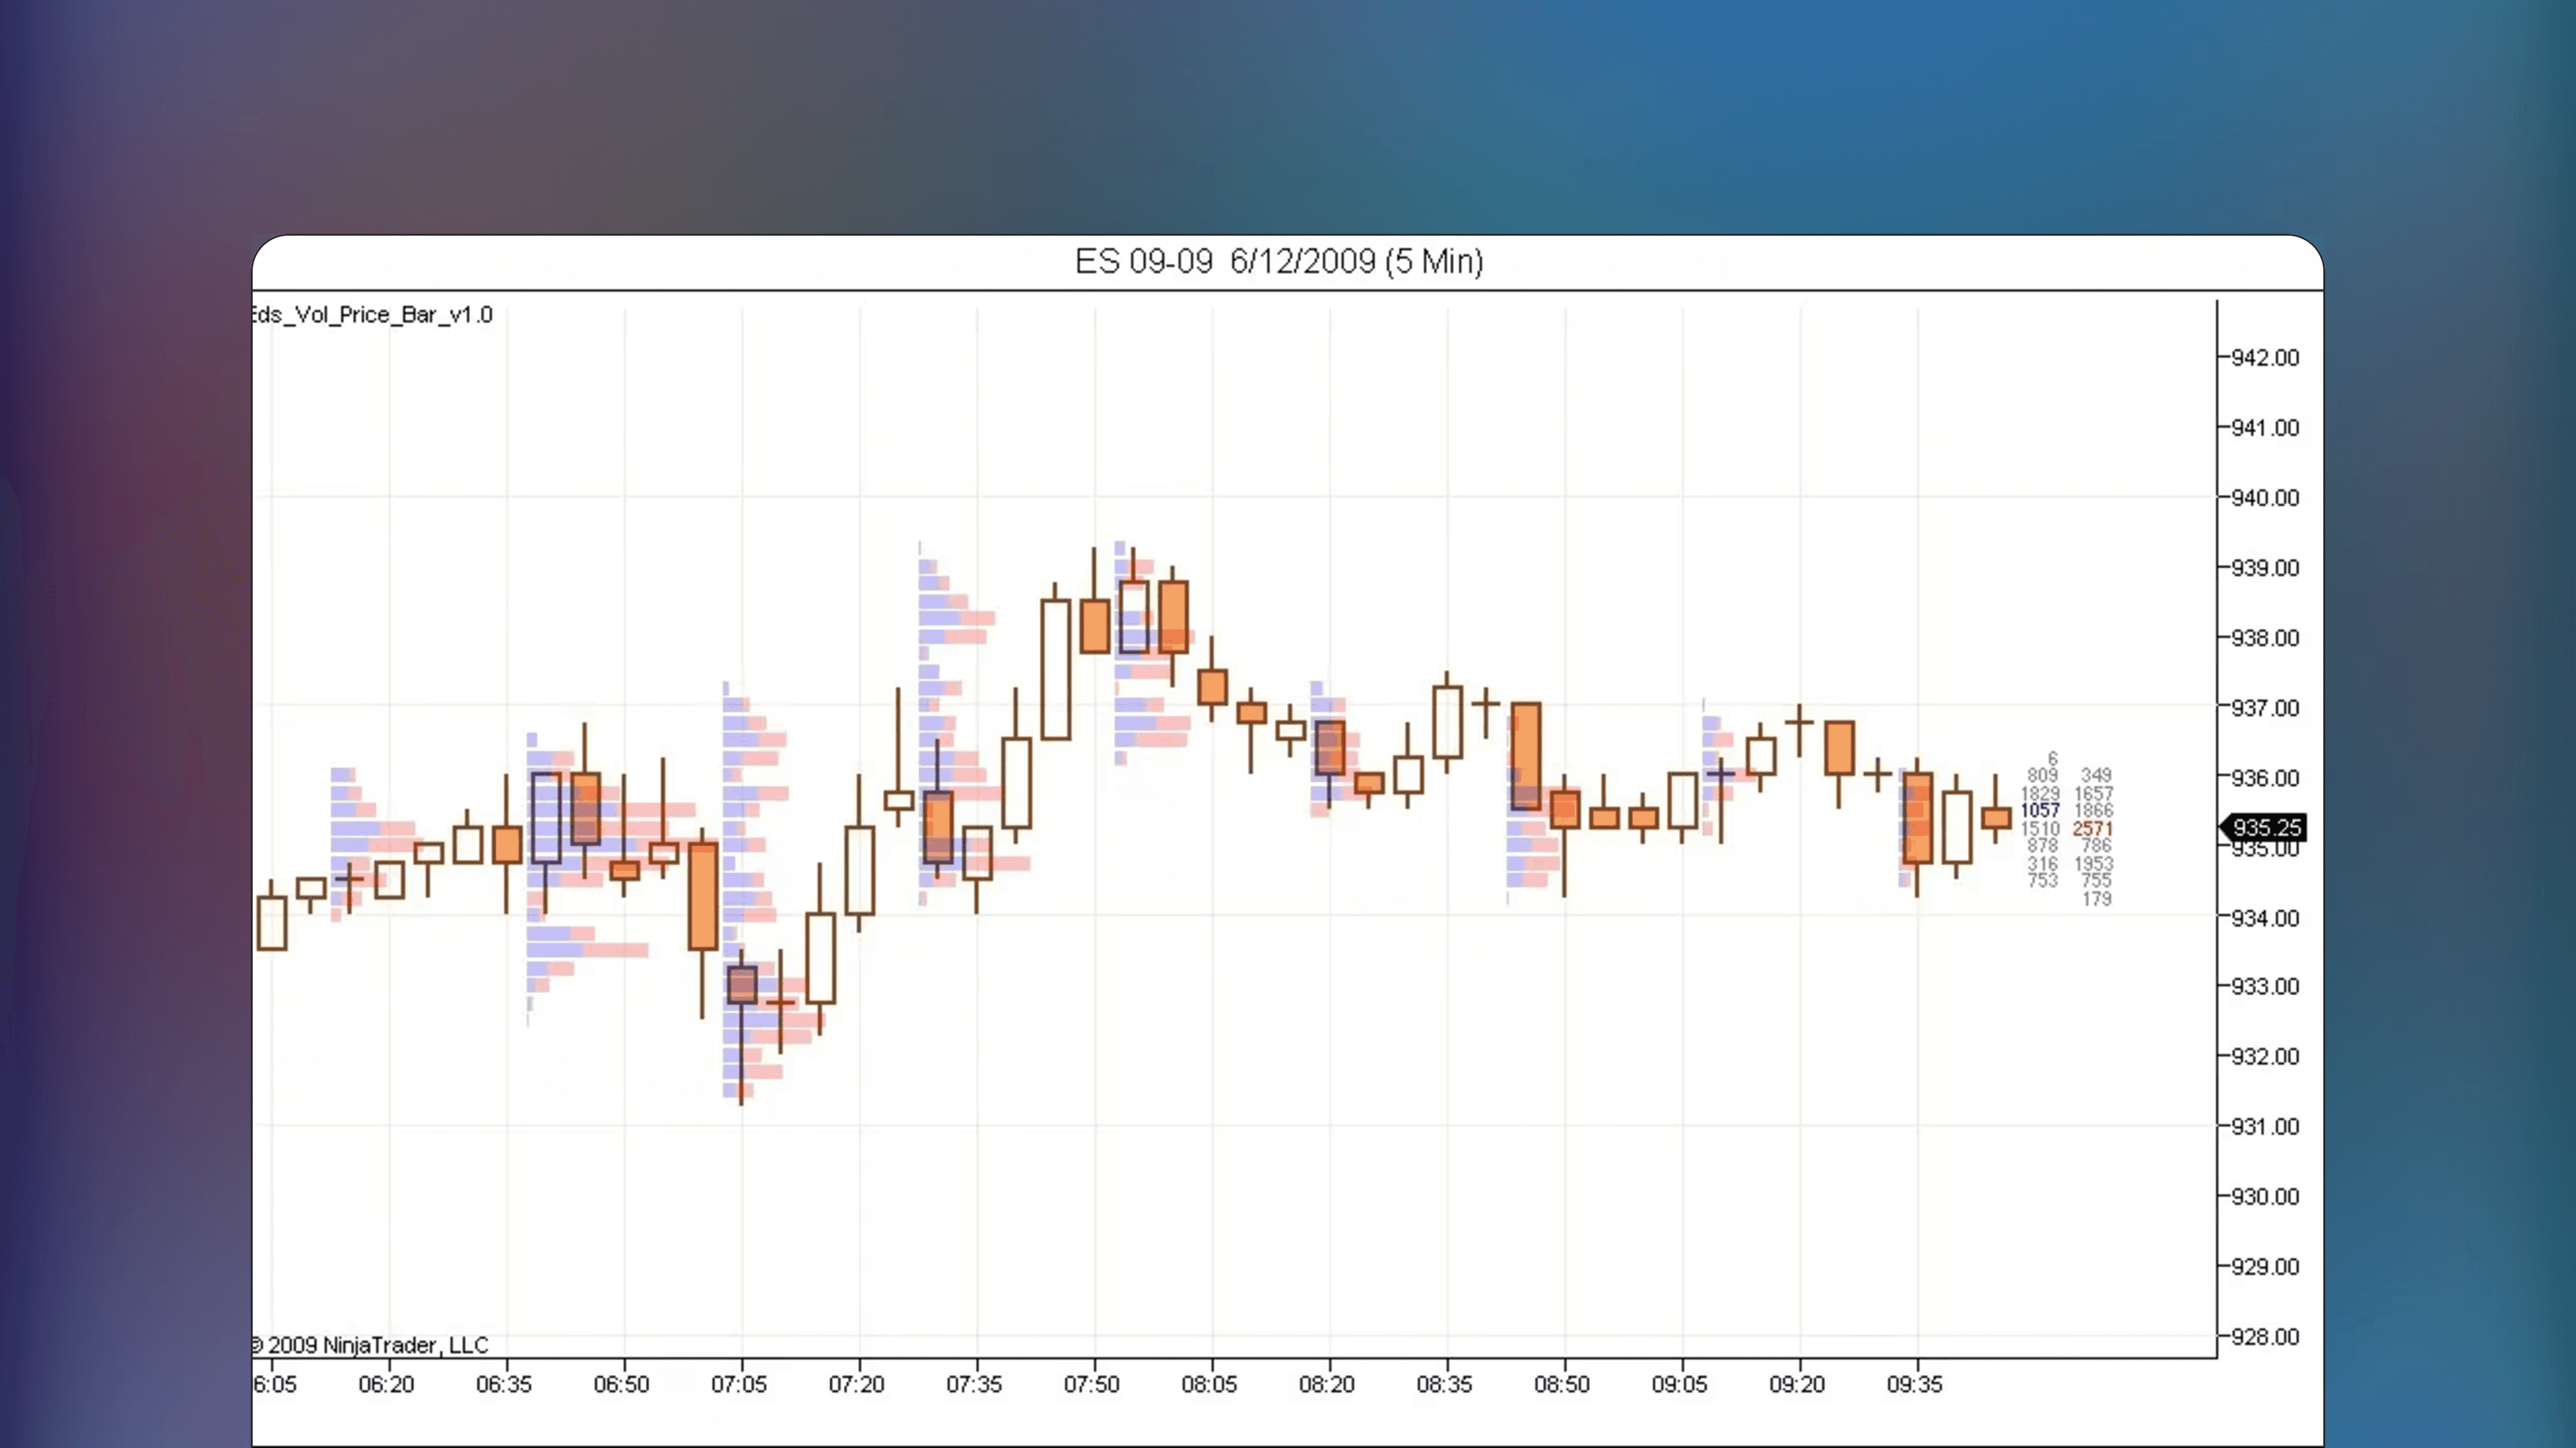
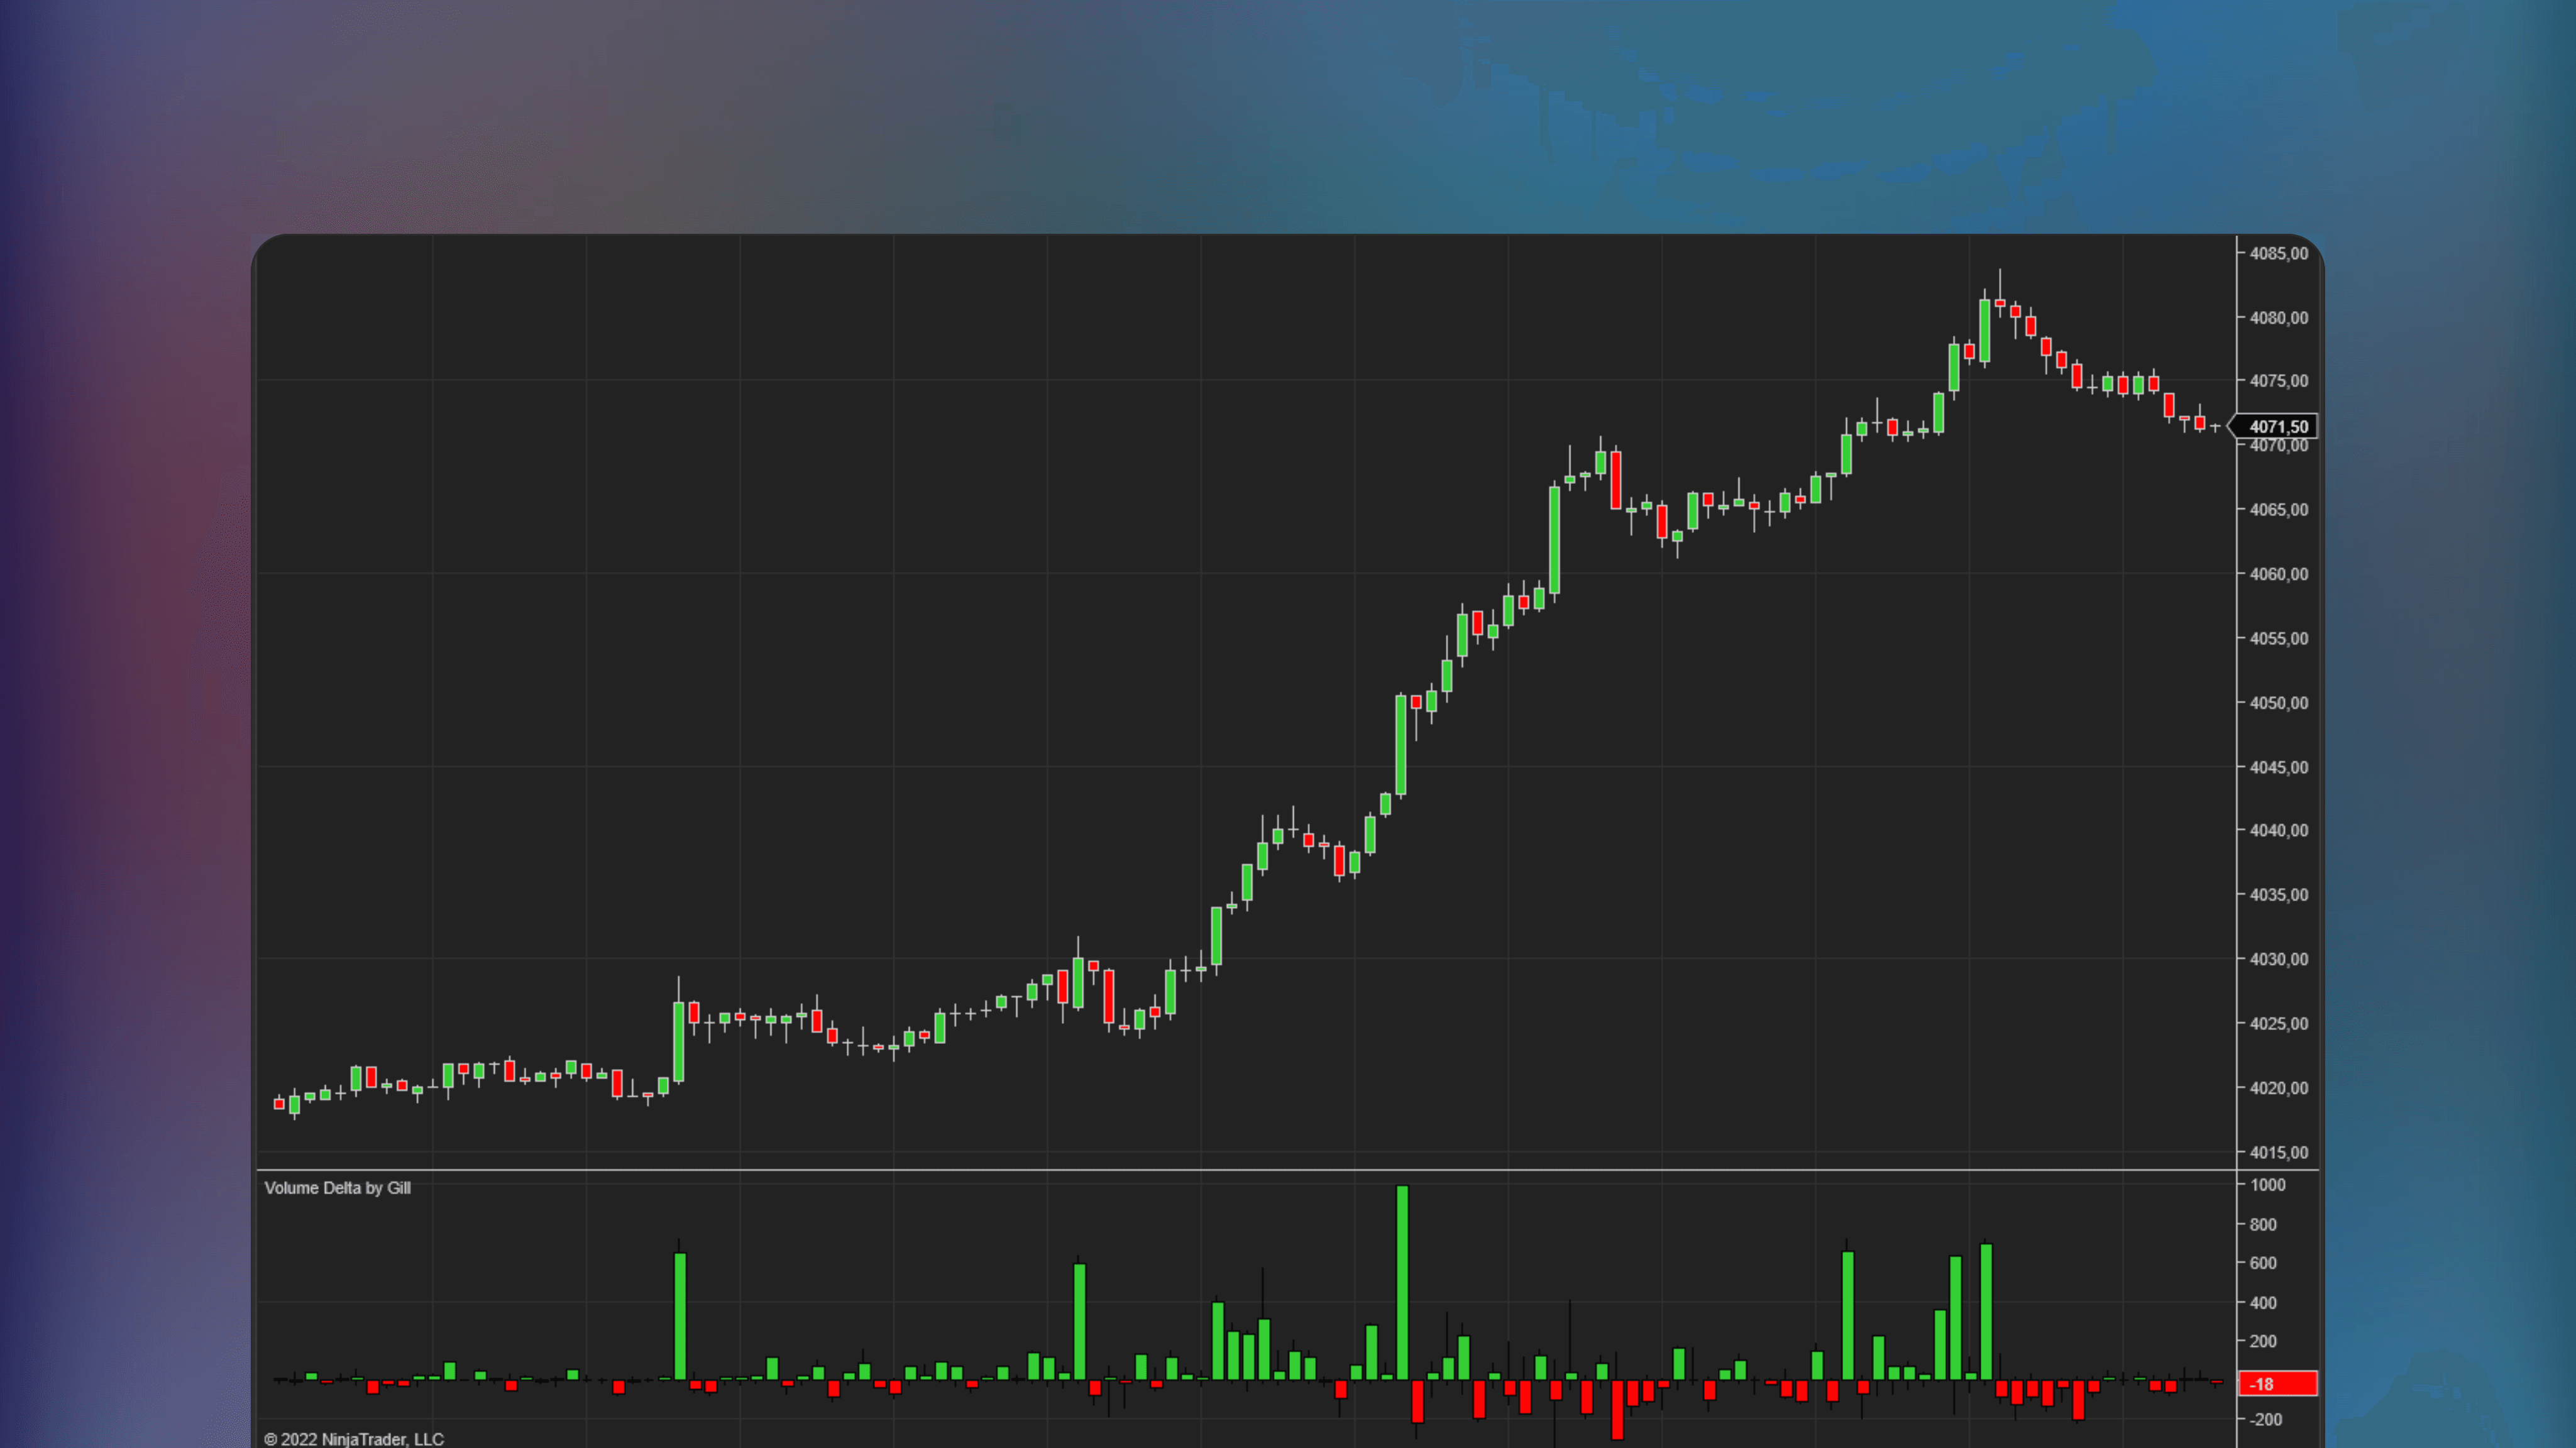
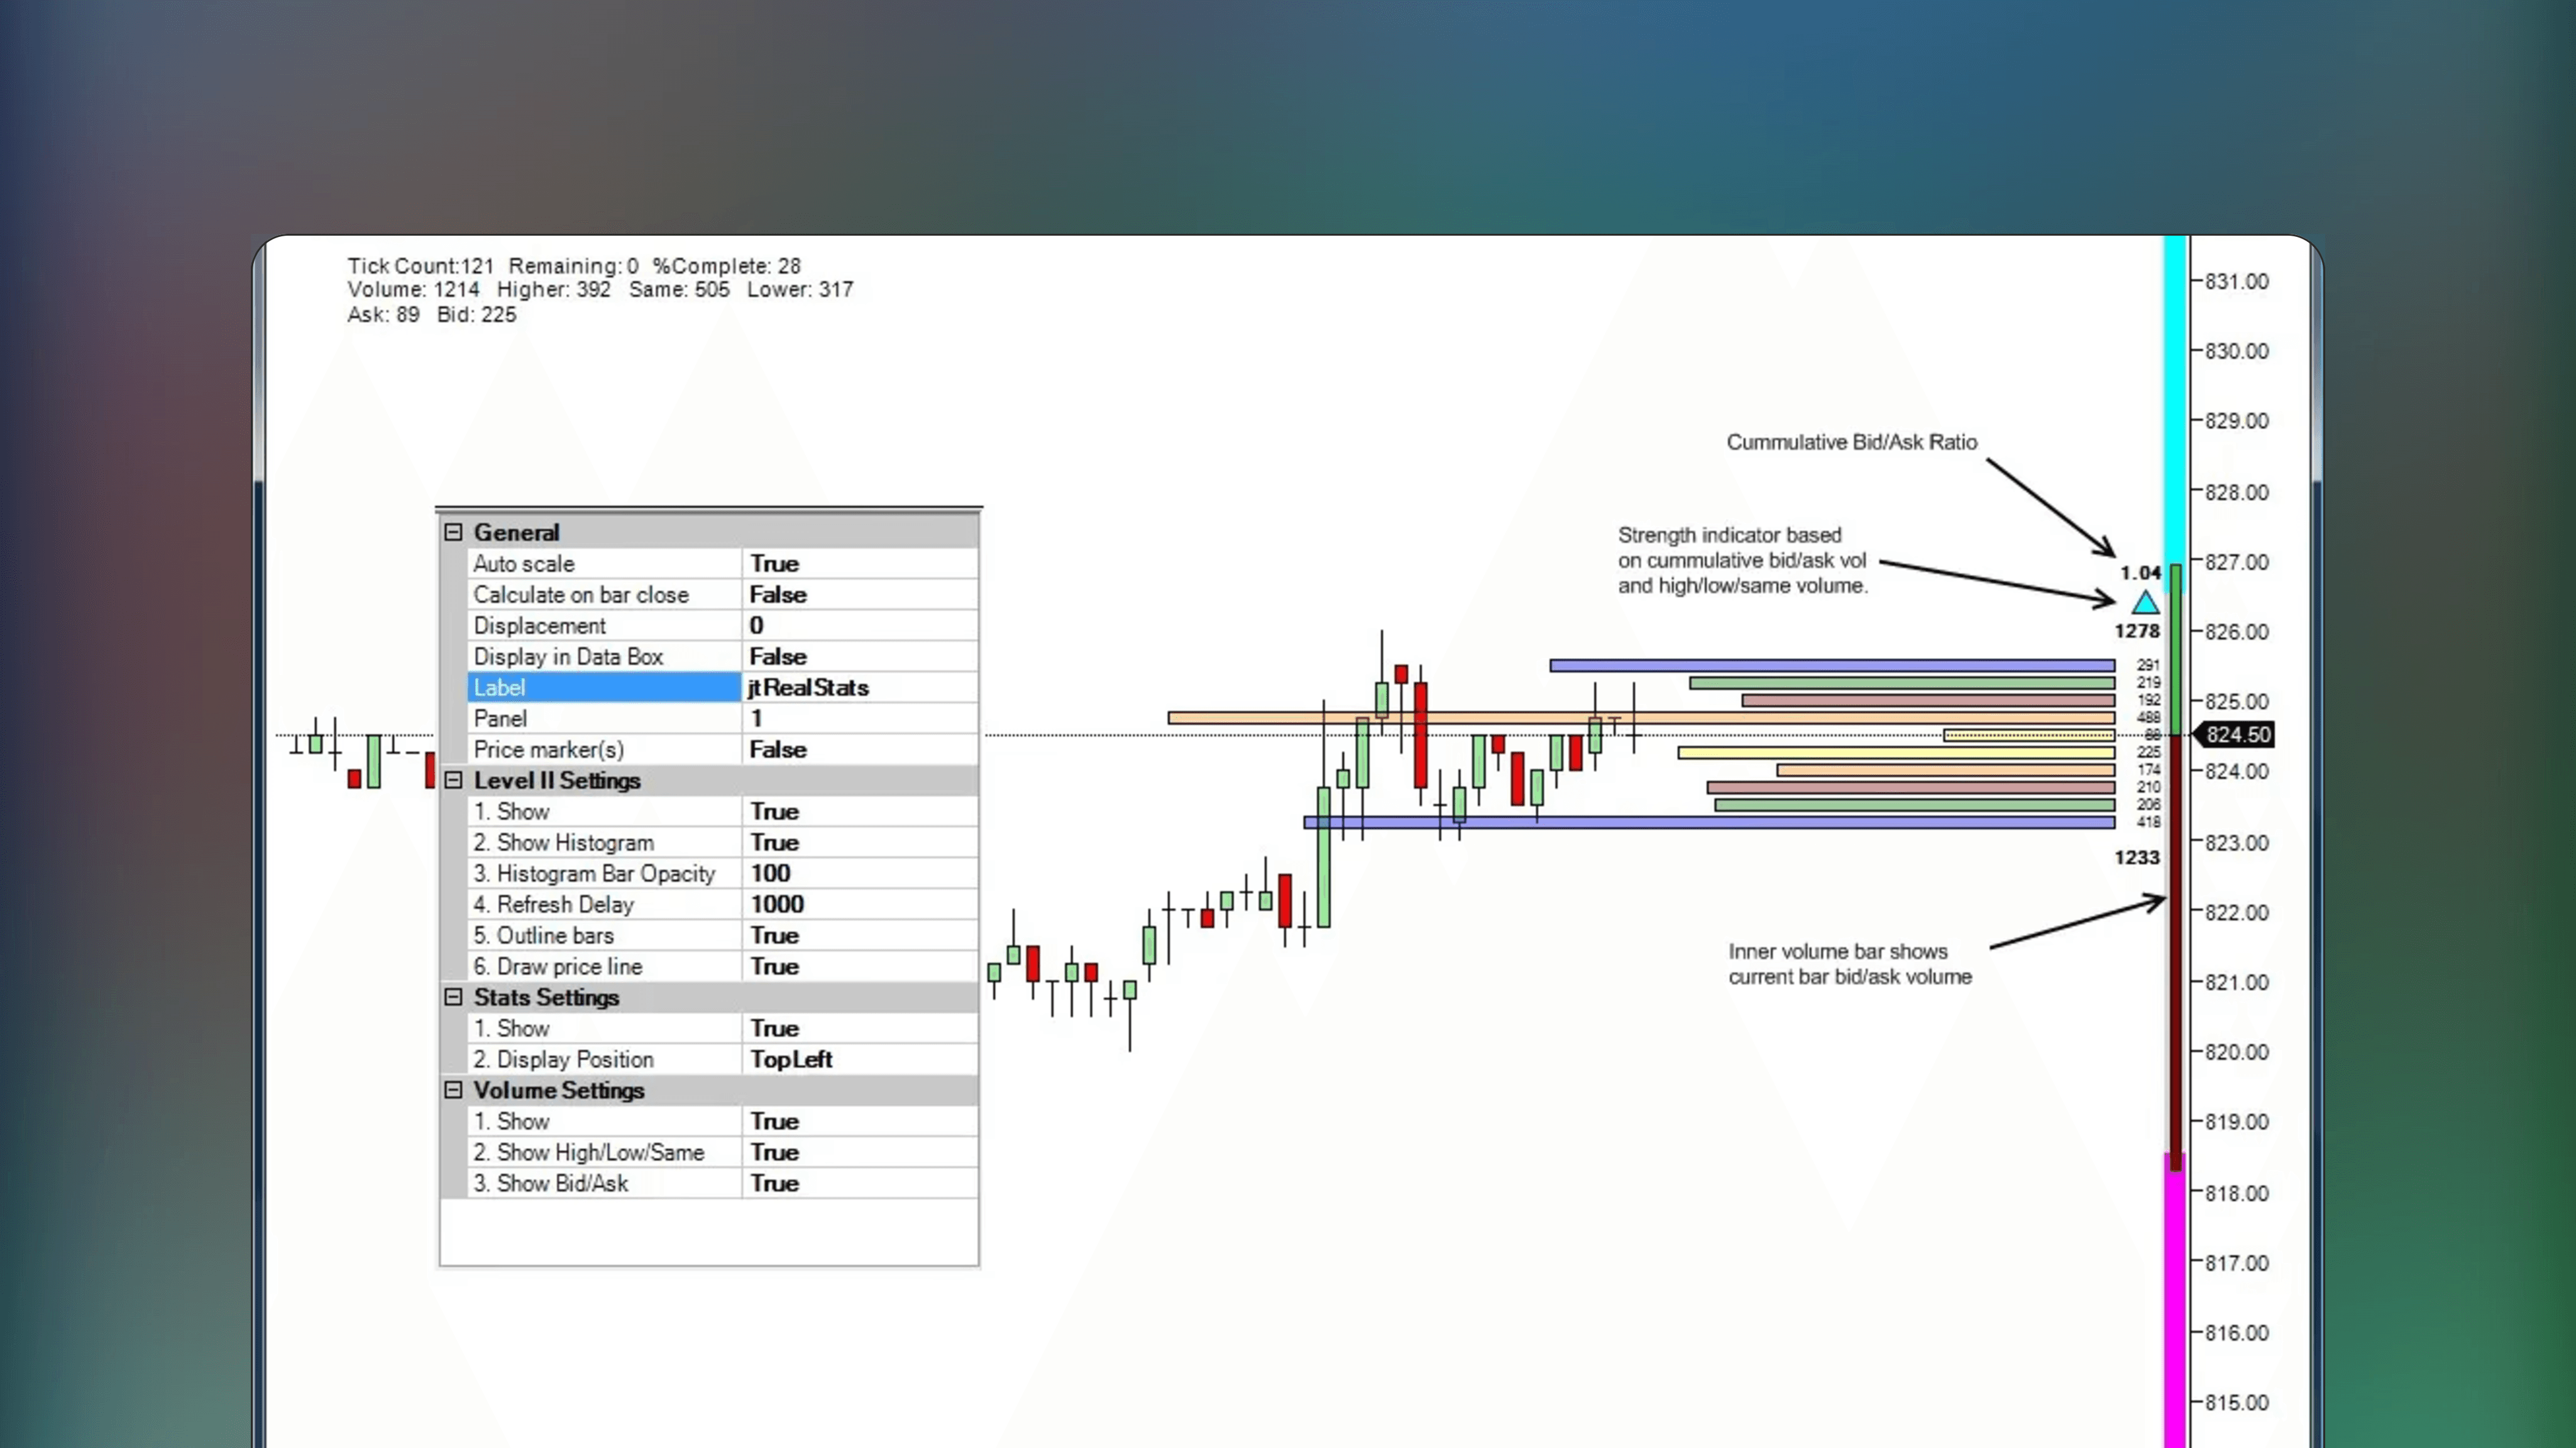
Bi-Directional Buy Sell Volume Super DOM Column is a NinjaTrader indicator that visualizes buy and sell volumes at price, displayed side by side.
Bi-Directional Buy Sell Volume Super DOM Column is a NinjaTrader indicator that visualizes buy and sell volumes at price, displayed side by side.
Get on NinjaTrader
This indicator is available on NinjaTrader charting platform. Signing up for a free account and downloading NinjaTrader software is required.
Get on NinjaTrader
This indicator is available on NinjaTrader charting platform. Signing up for a free account and downloading NinjaTrader software is required.
🔑
Open Source
Listing has publically available source code that can be audited and modified as needed.
🔑
Open Source
Listing has publically available source code that can be audited and modified as needed.
💸
Free Access
All features of this listing are fully free to use with no pricing tiers. Simply start using.
💸
Free Access
All features of this listing are fully free to use with no pricing tiers. Simply start using.
🥇
Trusted Publisher
Publisher of this listing is well recognized in social channels and receives overwhelmingly positive feedback.
🥇
Trusted Publisher
Publisher of this listing is well recognized in social channels and receives overwhelmingly positive feedback.
🌐
Popular Topic
Concepts and theories mentioned in listing are popular topics in web search
🌐
Popular Topic
Concepts and theories mentioned in listing are popular topics in web search
Published by NinjaTrader_PatrickH on NinjaTrader
Published by NinjaTrader_PatrickH on NinjaTrader
Featured Dec 6, 2024
Featured Dec 6, 2024
Bench mark buyer vs. seller strength at price
Bench mark buyer vs. seller strength at price
The NinjaTrader Indicator visually separates buy and sell volumes from a central point for intuitive read on volume delta. Let's take a look at how you can utilize the Bi-Directional Buy Sell Volume Super DOM Column in your market analysis.
The NinjaTrader Indicator visually separates buy and sell volumes from a central point for intuitive read on volume delta. Let's take a look at how you can utilize the Bi-Directional Buy Sell Volume Super DOM Column in your market analysis.
1
1
Assess buyer/seller strength
Assess buyer/seller strength
2
2
Identify potential key levels
Identify potential key levels
3
3
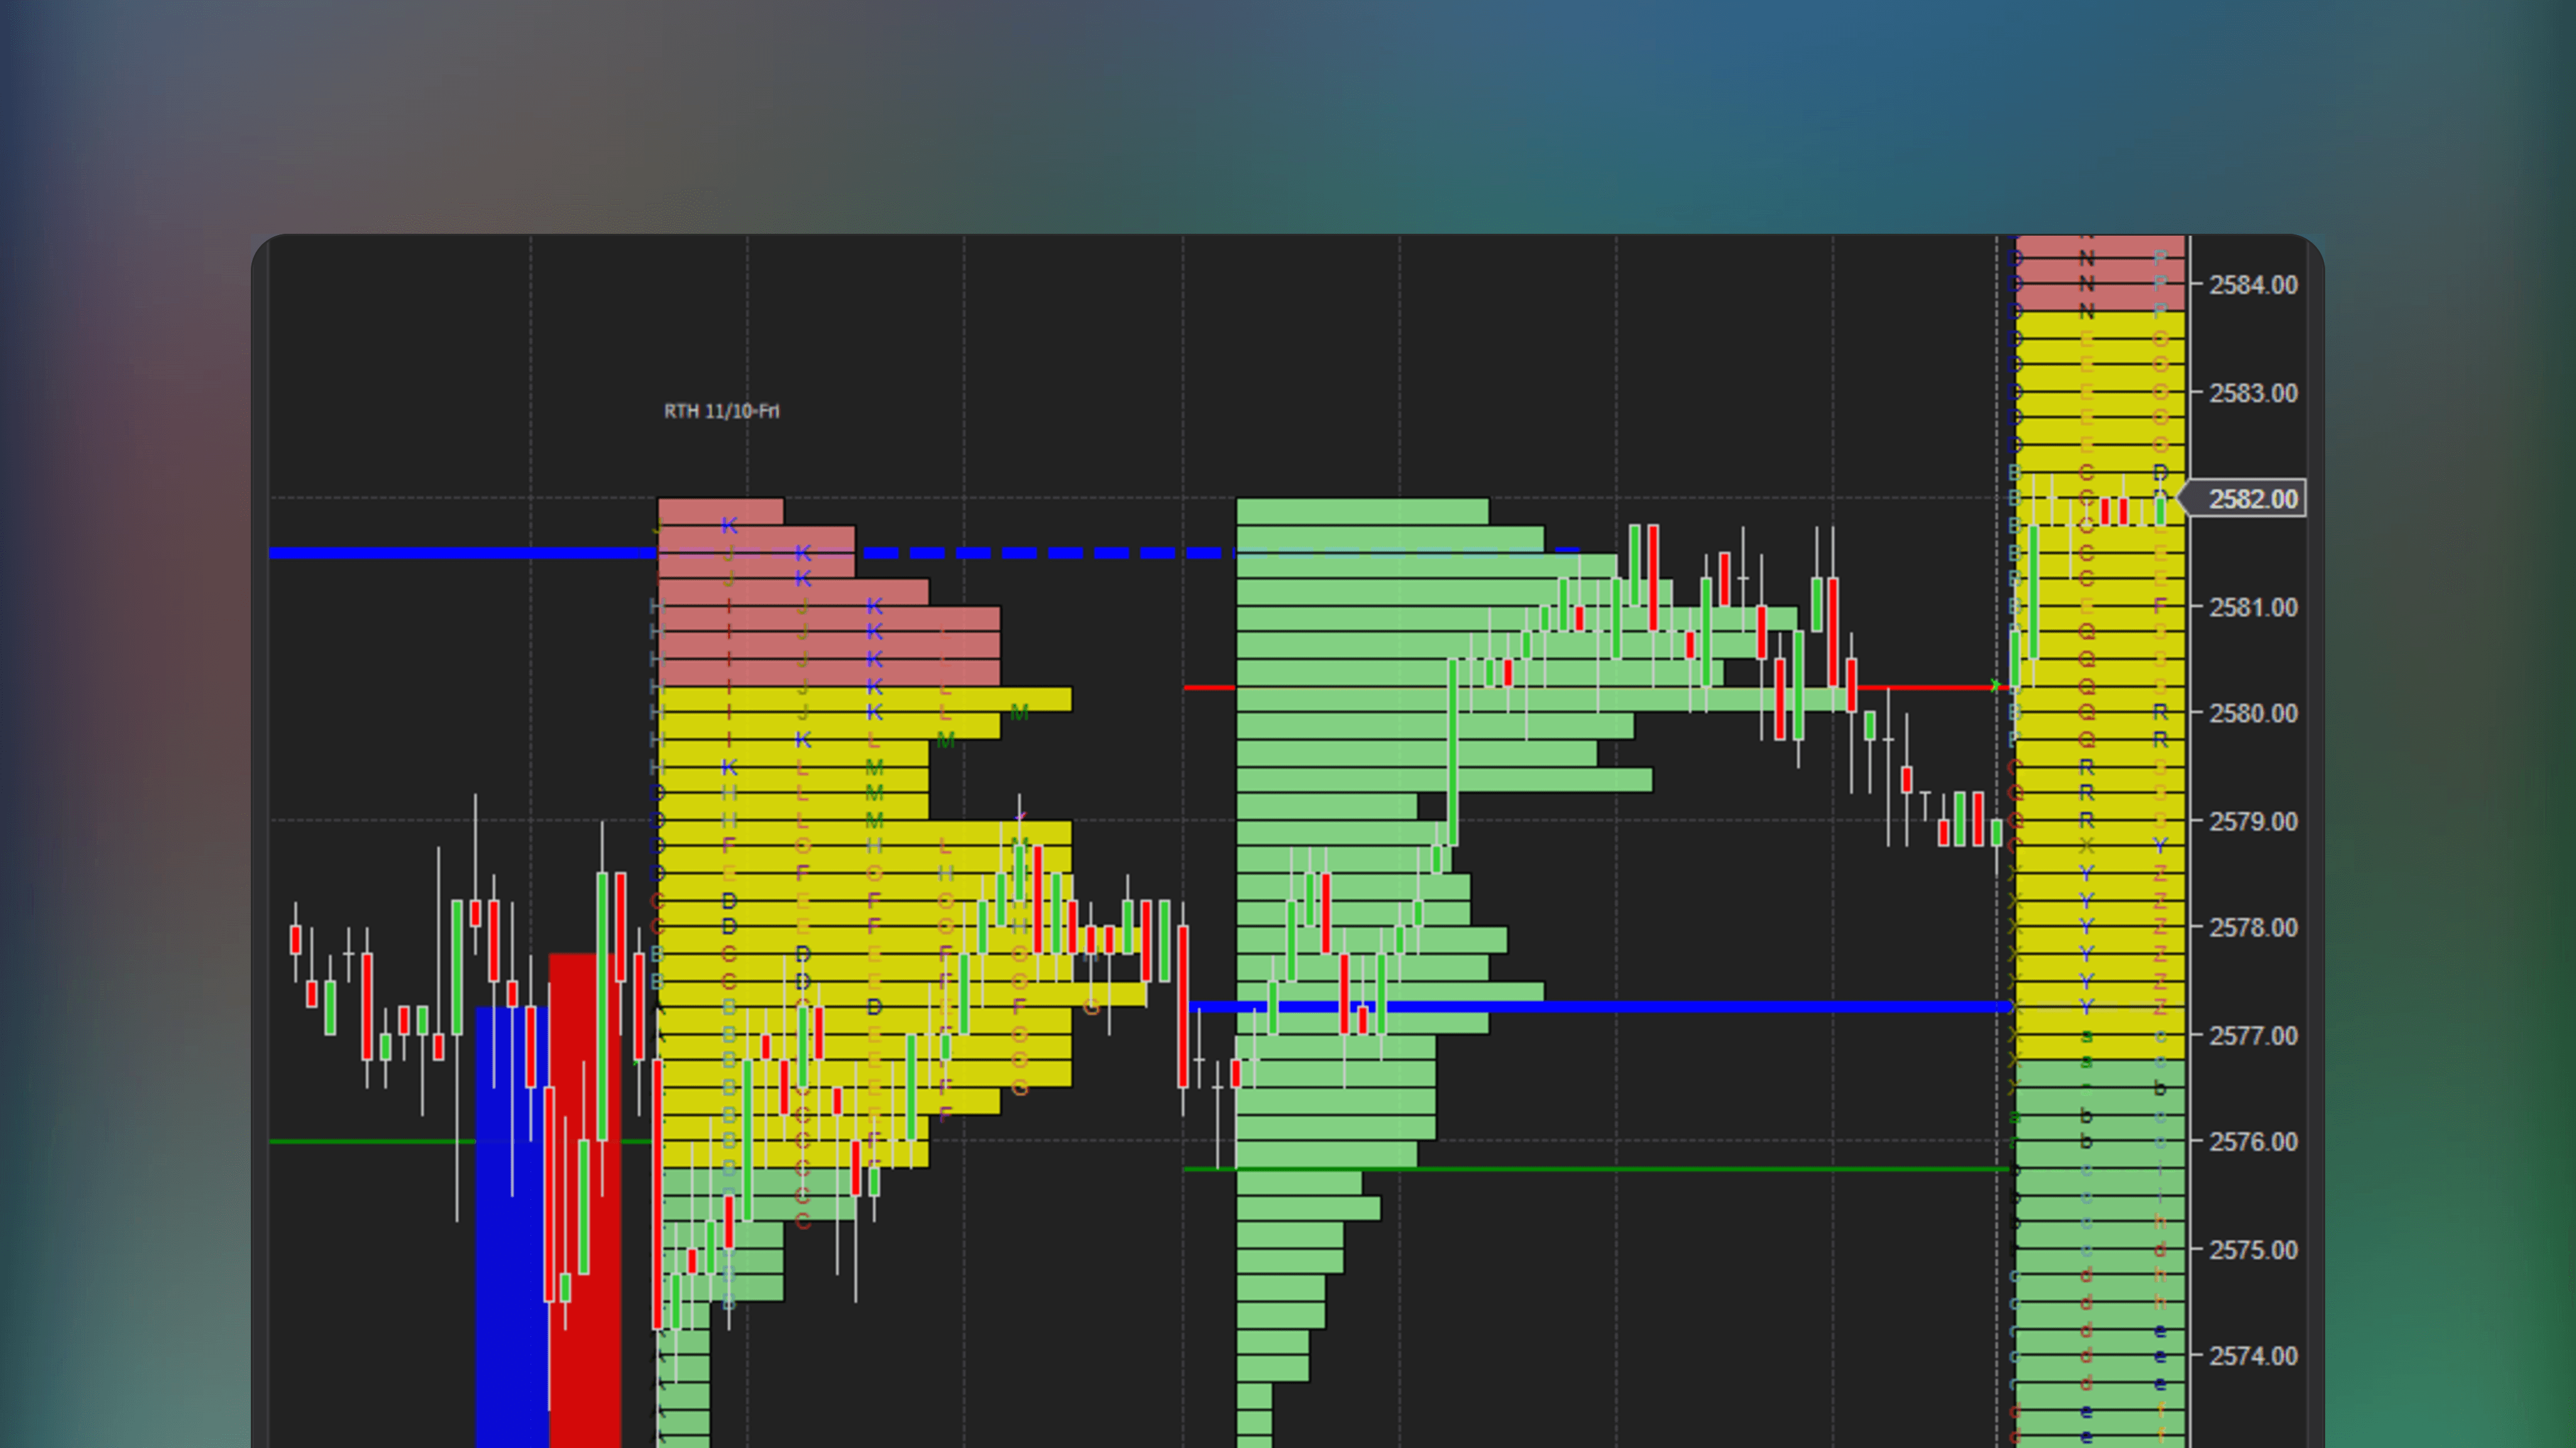
Apply Auction Market Theory concepts
Apply Auction Market Theory concepts
😃
😃
Traders are happy with this
Traders are happy with this
Traders online feel positive about the Bi-Directional Buy Sell Volume Super DOM Column, valuing its advanced features, but note a steep learning curve and seek further improvements.
Traders online feel positive about the Bi-Directional Buy Sell Volume Super DOM Column, valuing its advanced features, but note a steep learning curve and seek further improvements.
Source: Online Discussion
Source: Online Discussion
Source: Online Discussion


Bookmark
Saved here
🤖
Get Indicator
Find Indicator
3
Comments
Read on Telegram
Listing by third party publisher. Not financial advice.
Risk Disclosure


Share Listing
🤖
🤖
Get Indicator
Get Indicator
Find Indicator
Find Indicator
Saved here
Bookmark
Listing by third party publisher. Not financial advice.
Listing by third party publisher. Not financial advice.
Risk Disclosure
Risk Disclosure
Share
🤖
3


🤖
3
🤖
3
✍️
By Author
More by NinjaTrader_PatrickH
🔥
New Listings
Featured this week

🤖
by benten


Free
ThinkOrSwim Indicator
Triple VWAP Indicator For ThinkOrSwim
New
🔑
✅
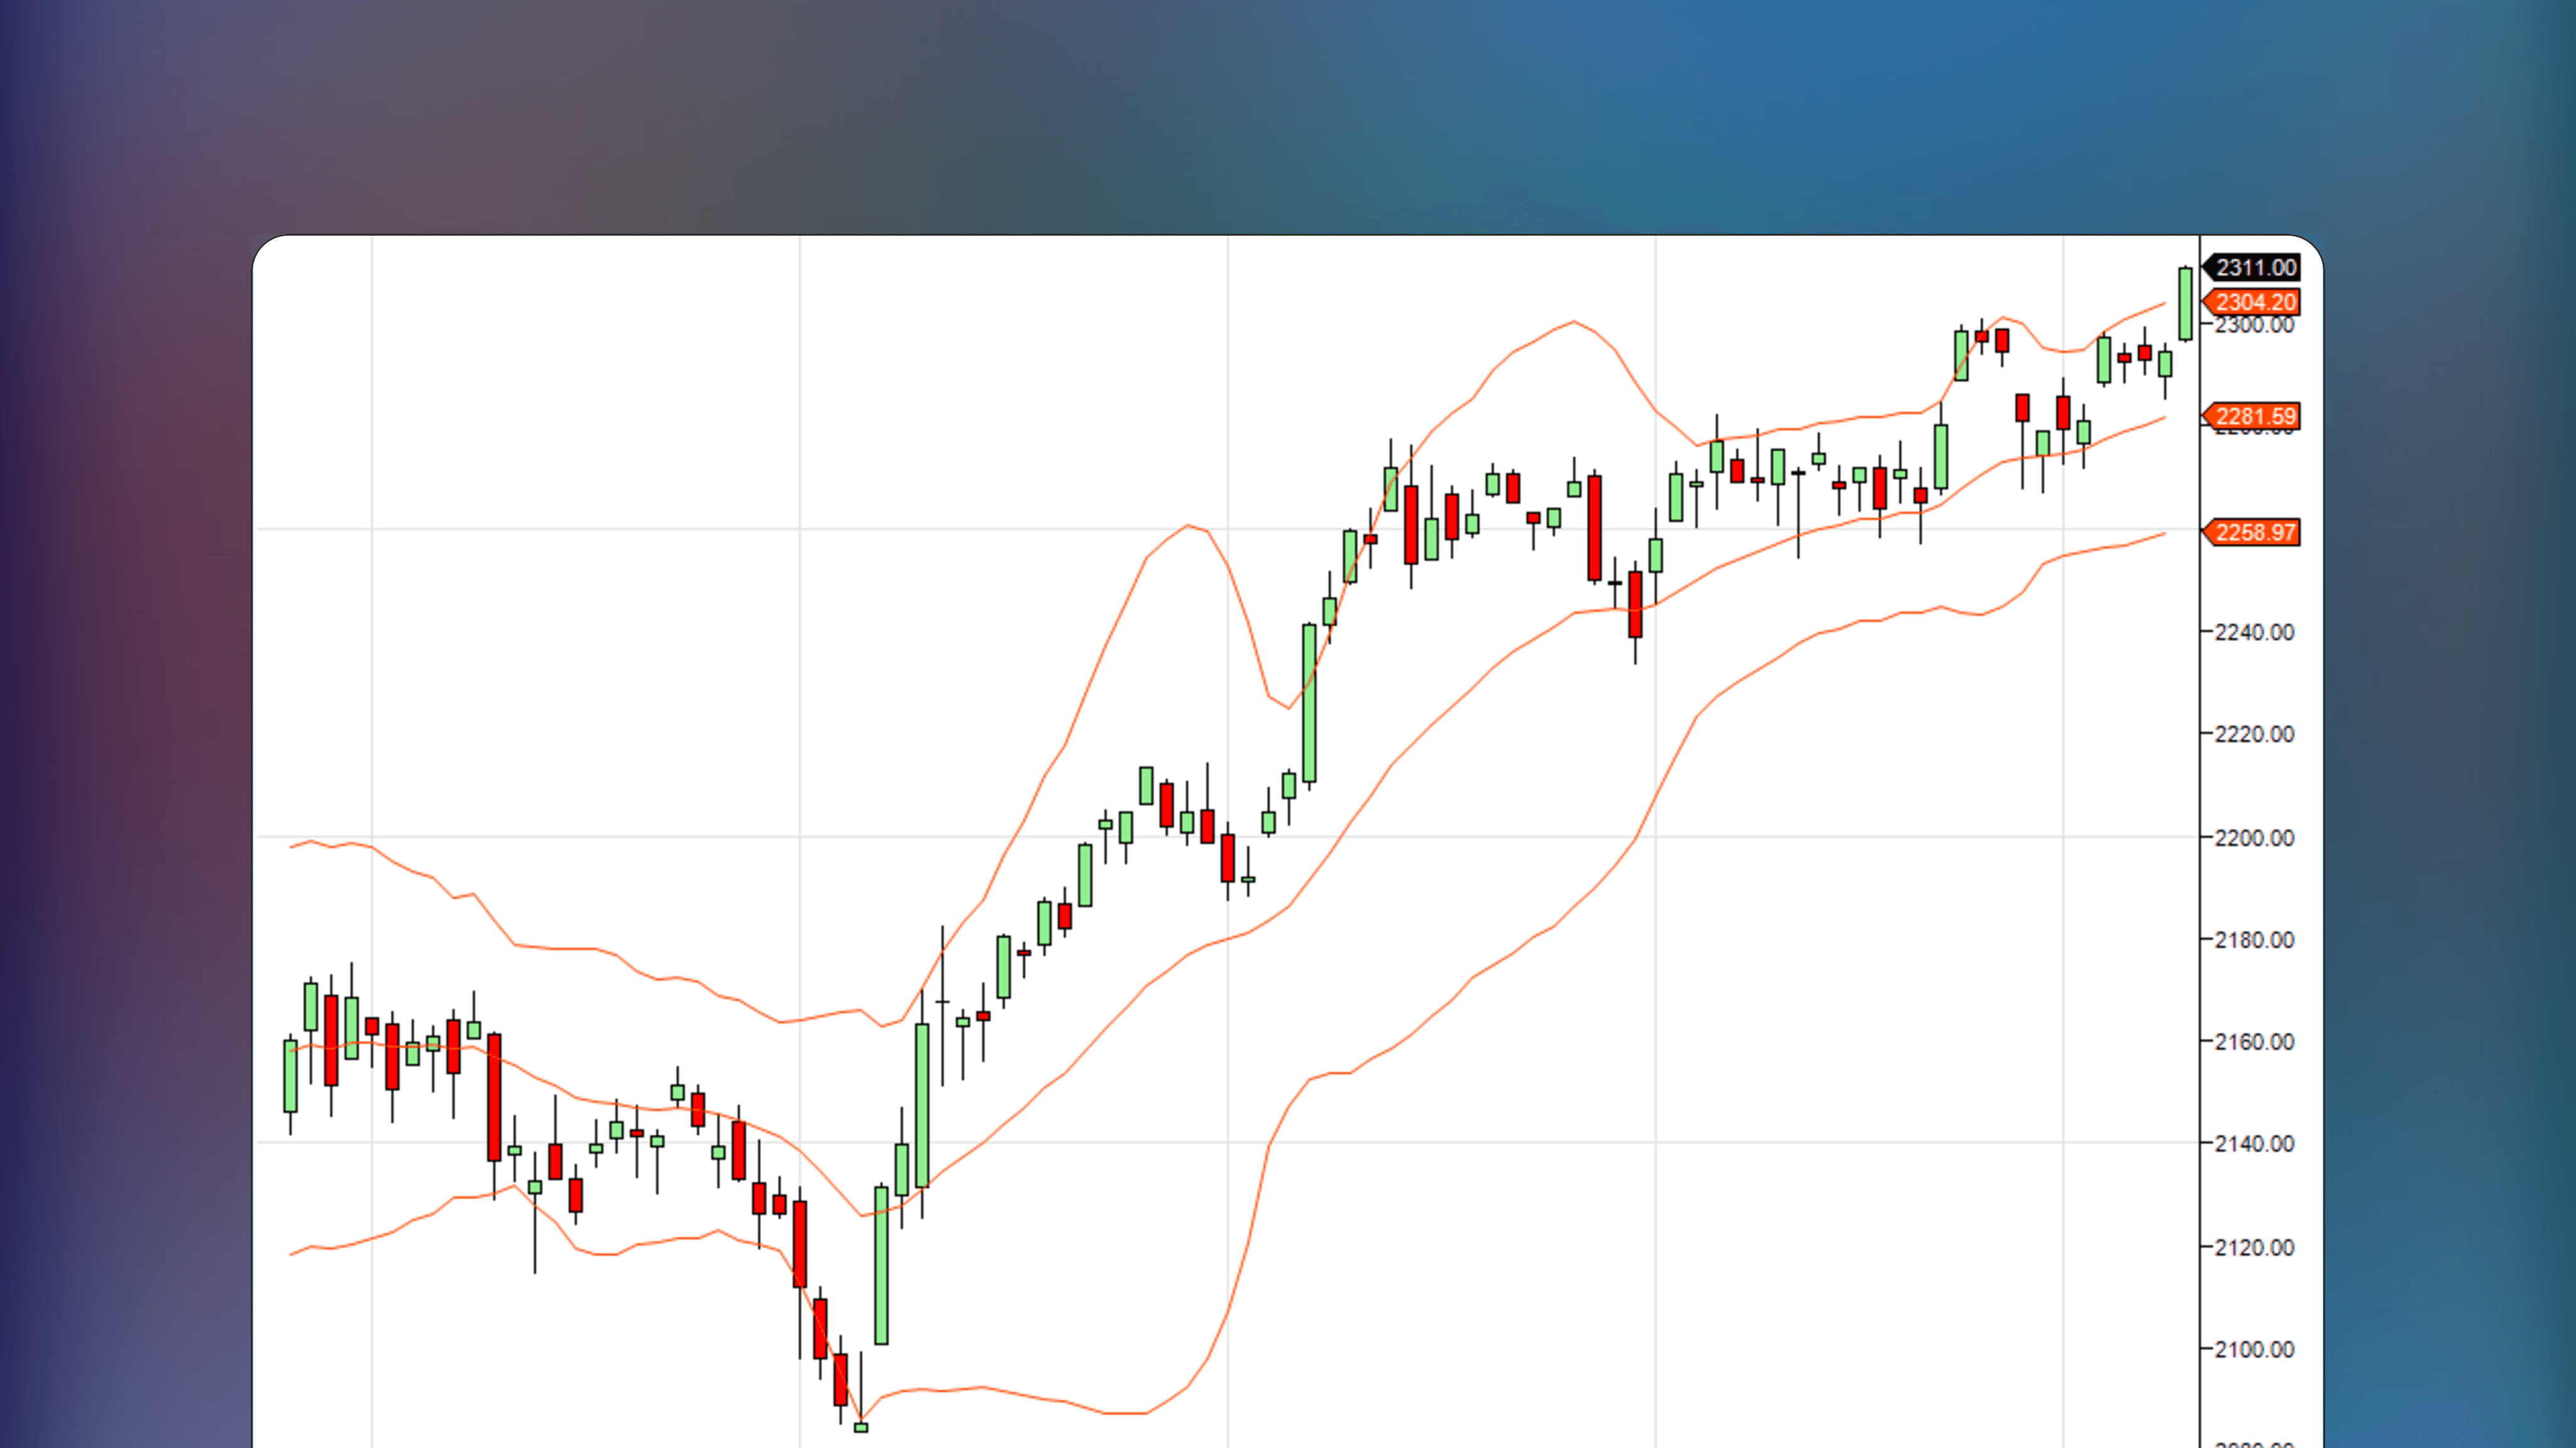
Triple VWAP Indicator for ThinkorSwim VWAP by adding 1 to 3 standard deviation bands alongside VWAP, providing a more detailed view of extreme deviations based on market volatility.
🤖
by scriptor


Free
MetaTrader Indicator
Volume_Accumulation
New
🔑
🌐
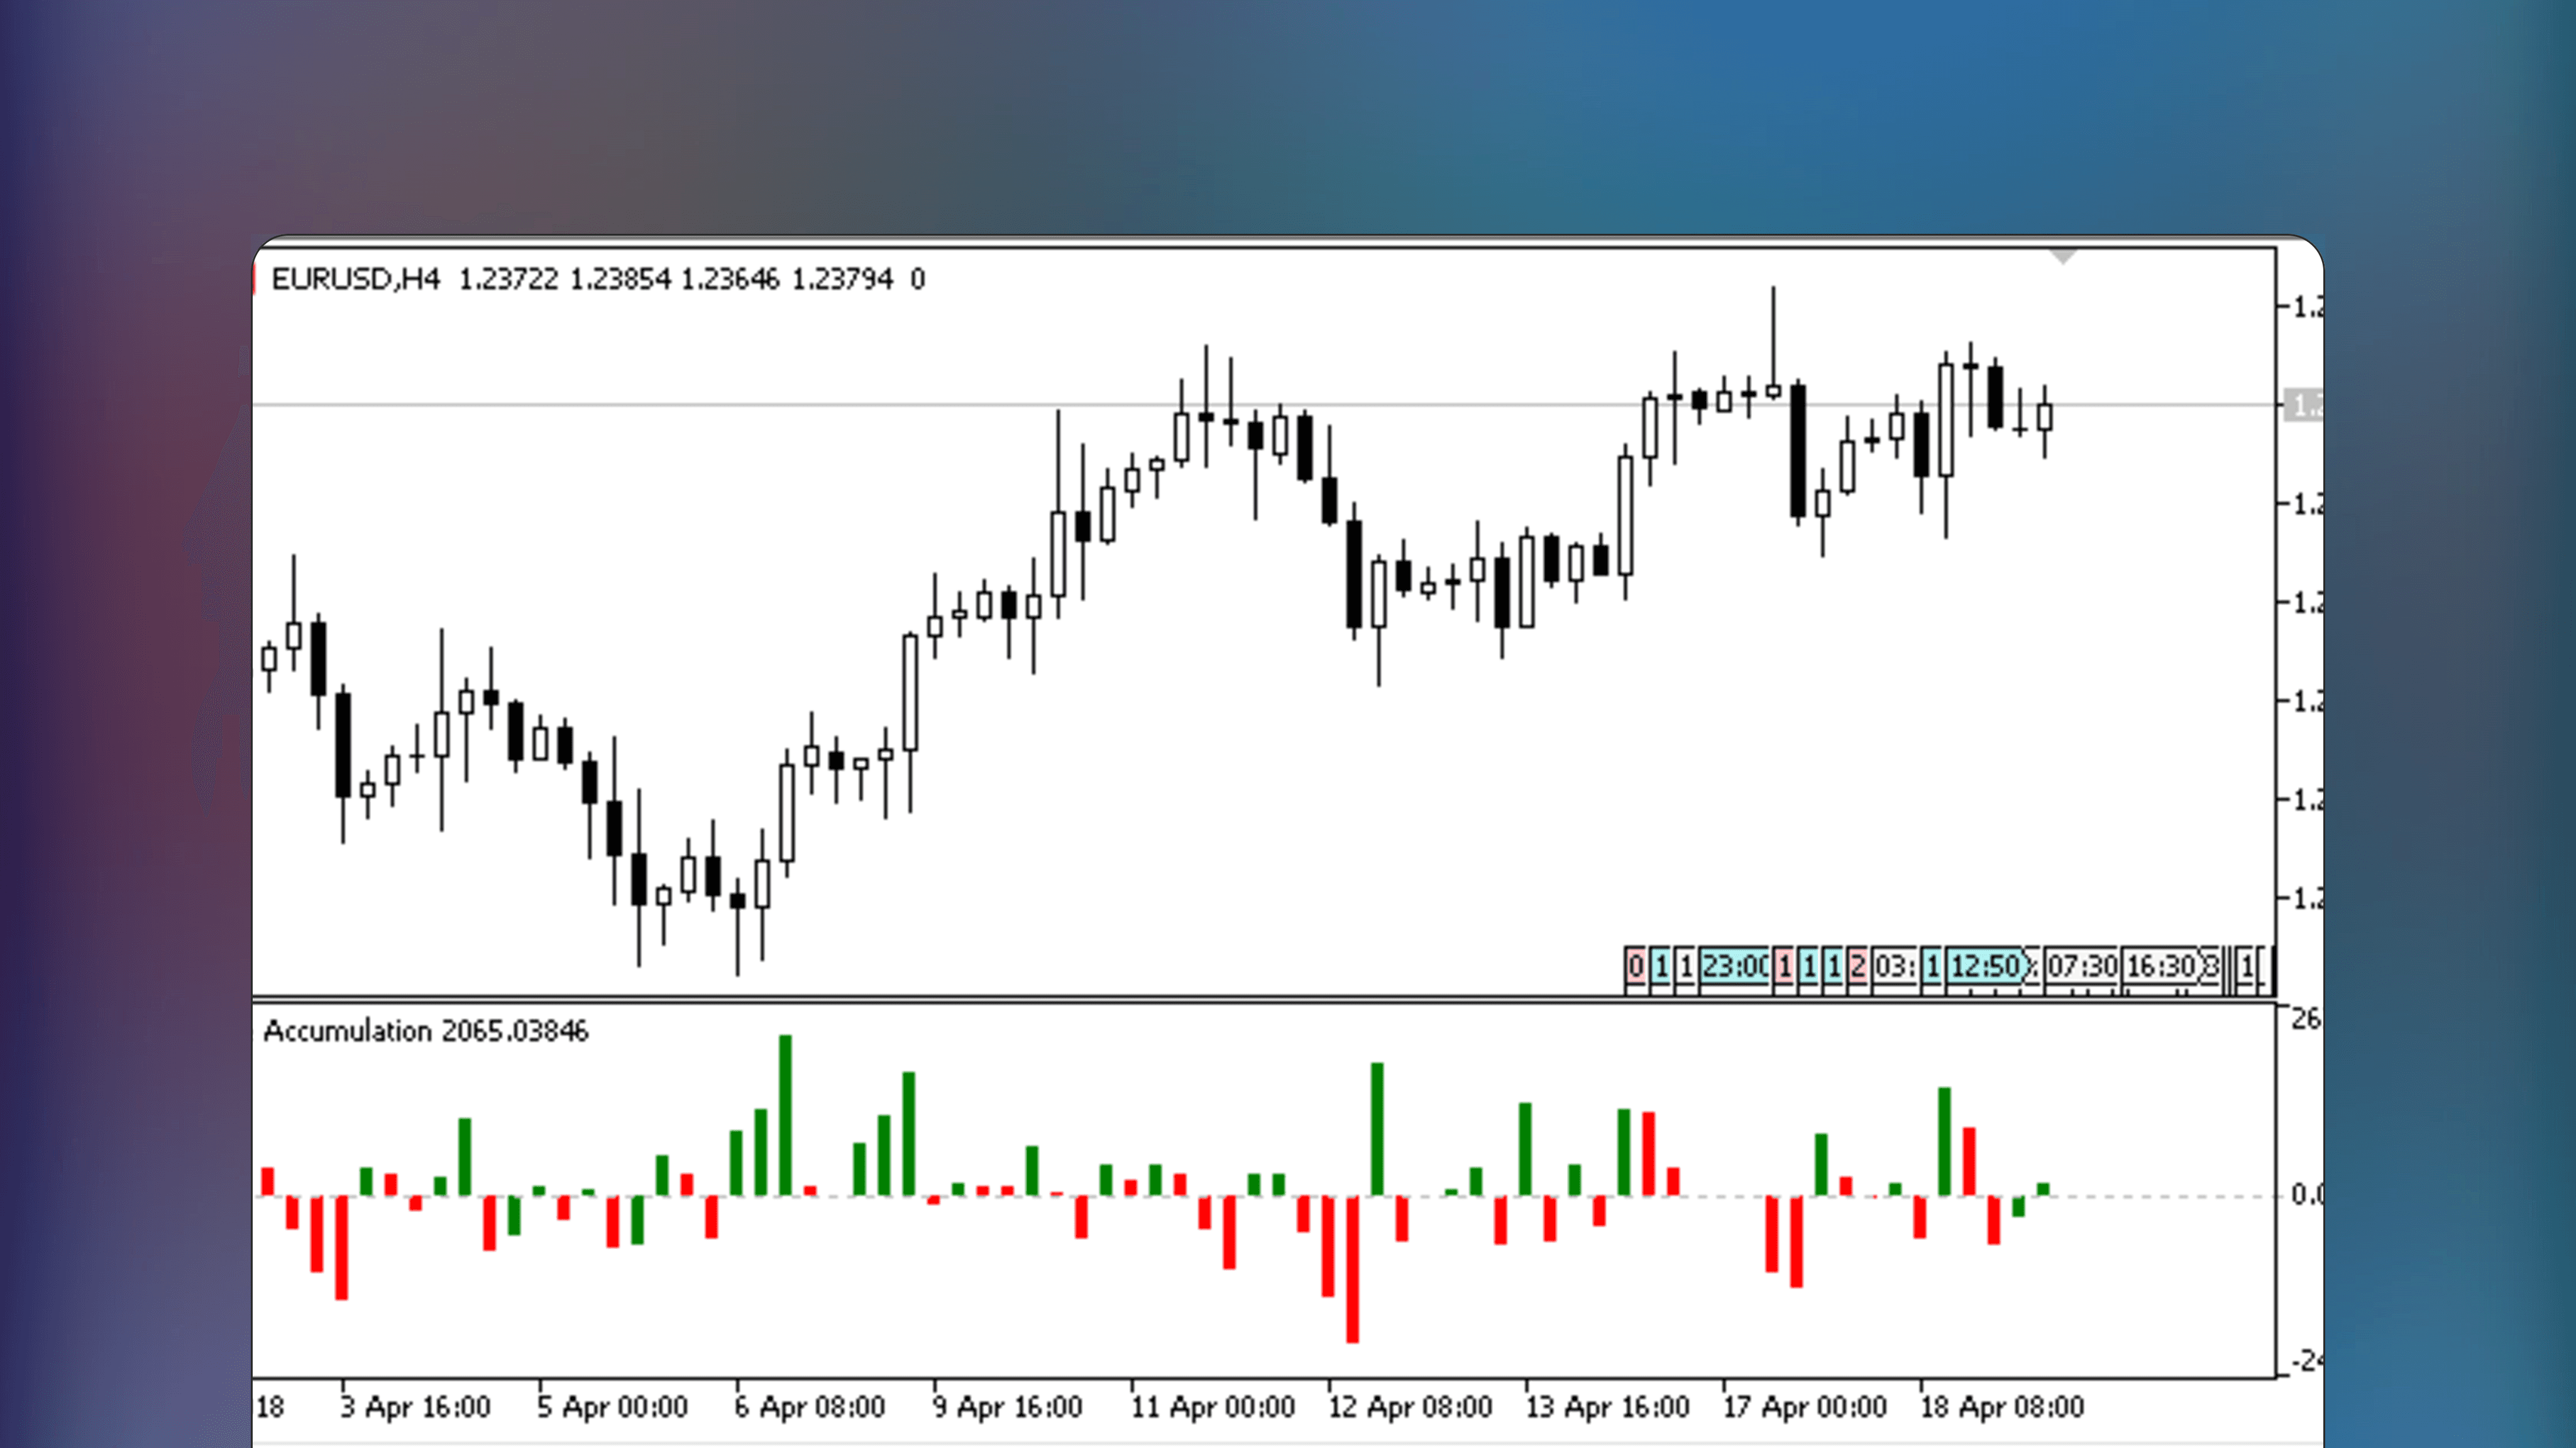
Volume_Accumulation is a MetaTrader Indicator that displays volume accumulation and distribution using a specialized formula. The indicator requires no inputs or settings, simply start using.
🤖
by twingall


Free
TradingView Indicator
FVGs & CEs + Alerts: simple & efficient method
New
🔑
✅
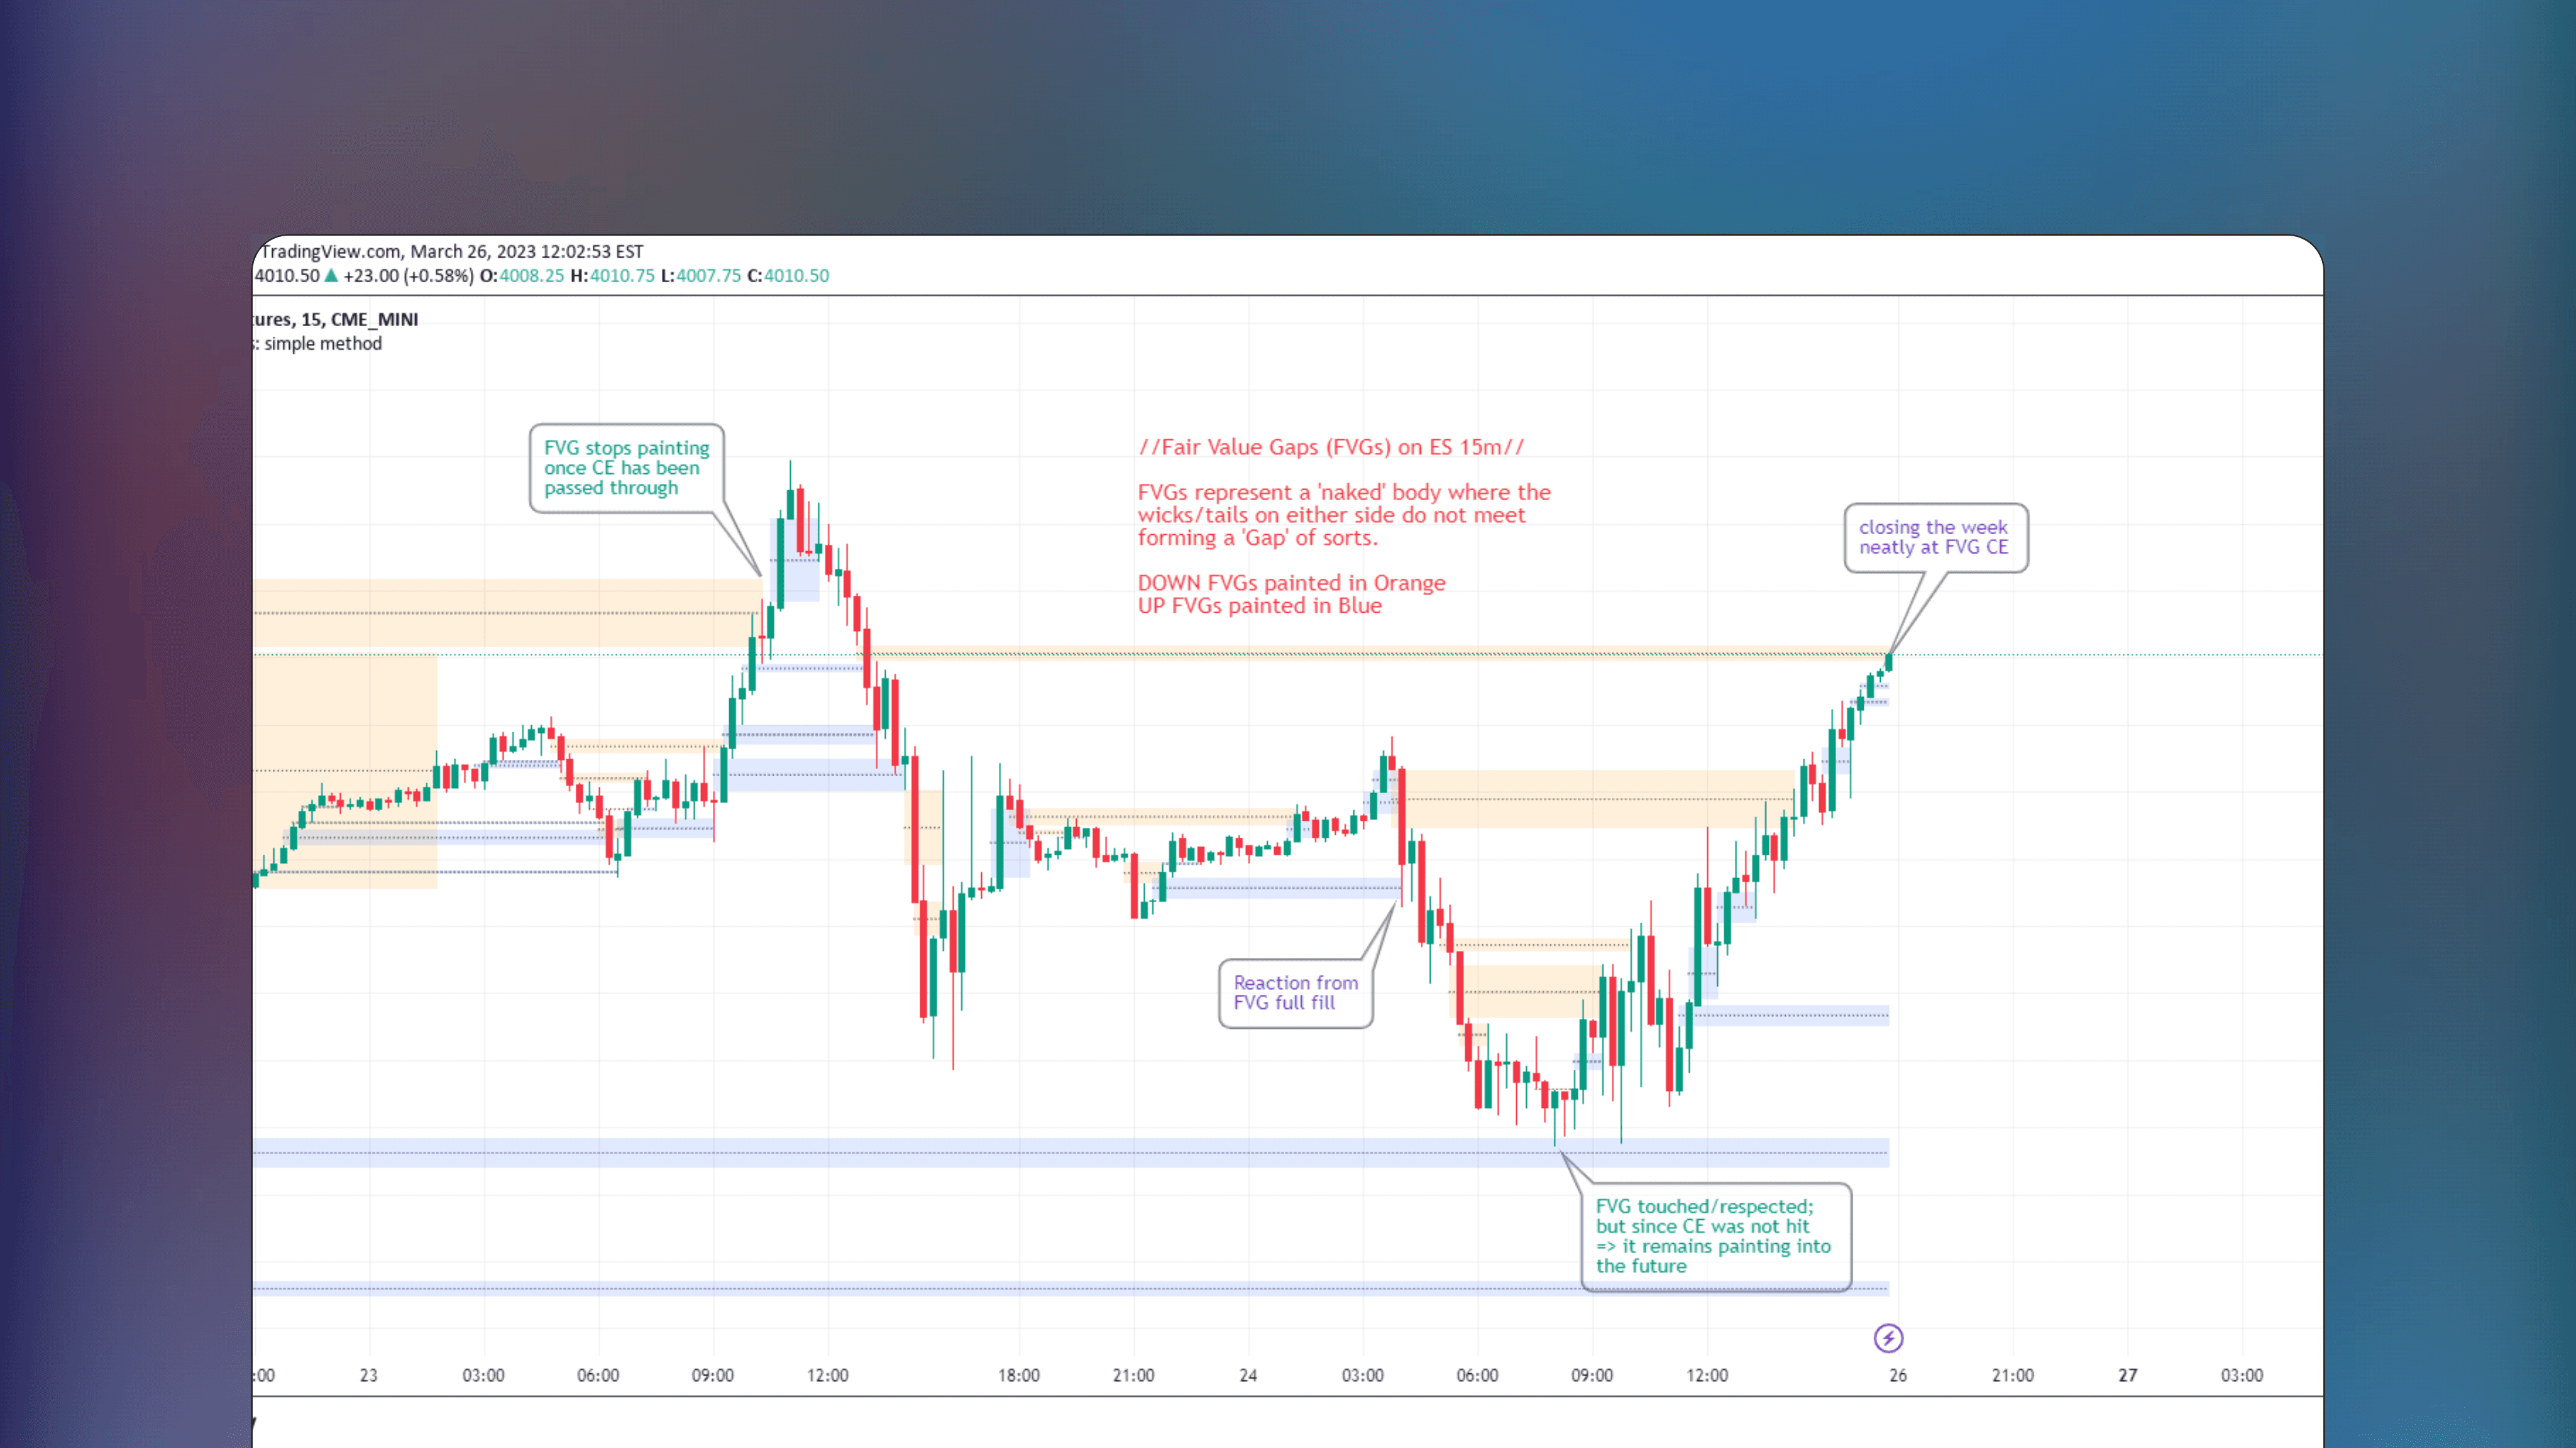
FVGs & CEs + Alerts is a TradingView indicator that identifies and marks Fair Value Gaps and their midlines. Fair Value Gaps are not displayed when conditions like hitting a CE or fully filling the gap are met, decreasing clutter. Includes alerts for fills.
🤖
by benten
Free
ThinkOrSwim Indicator
Triple VWAP Indicator For ThinkOrSwim
New
🔑
✅
Triple VWAP Indicator for ThinkorSwim VWAP by adding 1 to 3 standard deviation bands alongside VWAP, providing a more detailed view of extreme deviations based on market volatility.
🤖
by scriptor
Free
MetaTrader Indicator
Volume_Accumulation
New
🔑
🌐
Volume_Accumulation is a MetaTrader Indicator that displays volume accumulation and distribution using a specialized formula. The indicator requires no inputs or settings, simply start using.
Load More
🤖
Similar Listings
Traders also viewed
All


🤖
by ivatan1962
Free
NinjaTrader Indicator
Market Profile
🔑
🌐
✅
Market Profile is a NinjaTrader indicator for classic orderflow analysis based on auction market theory. It includes features like Initial Balance, Open Range, TPO, Price and Volume Histograms, Value Area, POC, and Virgin POC, providing everything essential for an orderflow trader.
🤖
by edsfreedom
Free
NinjaTrader Indicator
Eds Volume Price Bar
🔑
🌐
Eds Volume Price Bar is a free NinjaTrader Indicator that visualizes real-time volume at specific price levels in a volume profile style. Buy and sell volume are visualized separately for gauging volume delta.
🤖
by DeanV
Free
NinjaTrader Indicator
Dvaluearea
🔑
🌐
✅
Dvaluearea is a NinjaTrader Indicator that visualizes intra-day volume distribution based on session data. It displays the day's Value Area and highlights key levels with unusual volume activity.
🤖
by NinjaTrader_ChelseaB
Free
NinjaTrader Indicator
Igmarketprofile
🔑
🌐
✅
🏅
Igmarketprofile is a free NinjaTrader Indicator that analyzes volume distribution across various price levels for classical orderflow analysis and easy identification of points of control (POC).

🤖
by PaulMohn
Free
NinjaTrader Indicator
SimplePOC – Non TickReplay POC Script Use
🔑
SimplePOC – Non TickReplay POC Script Use is a NinjaTrader indicator that visualizes the Point of Control within candles using a simple white line and additionally displays regular volume data in a secondary panel.
🤖
by siroki
Free
NinjaTrader Indicator
Vwap (Volume Weighted Average Price)
🔑
🌐
✅
Vwap (Volume Weighted Average Price) is a NinjaTrader Indicator that calculates and plots the 1-day VWAP over intraday price charts.
🤖
by GillRymhes
Free
NinjaTrader Indicator
Delta Volume Update
🔑
🌐
✅
Delta Volume Update is a free NinjaTrader Indicator that visualizes volume delta in a simple histogram. Optionally visualizes cumulative volume delta and cumulative volume delta divergences.

🤖
by Sim22
Free
NinjaTrader Indicator
Equivolume ++ Chartstyle
🔑
🌐
Equivolume ++ Chartstyle is a NinjaTrader Indicator that refines chart visuals by automatically adjusting bar width and spacing based on volume change. This indicator features an autosize option, precise thickness calculations and customizable candlestick opacity.
🤖
by j0hnth0m
Free
NinjaTrader Indicator
Realtime Level Ii/Tick Volume
🔑
🌐
Realtime Level II/Tick Volume is an Indicator that delivers real-time up/down tick volume for the current chart, compatible with any instrument, timeframe and chart type.

🤖
by NinjaTrader_DaveI
Free
NinjaTrader Indicator
Equivolume Chart Style
🔑
Equivolume Chart Style is a free Indicator for NinjaTrader 8 based on traditional Candlesticks adjusted to volume traded, visualized in candlestick width.

🤖
by soon123
Free
NinjaTrader Indicator
RelativeVolume NT8
🔑
🌐
✅
RelativeVolume NT8 is a NinjaTrader Indicator that displays volume magnitude relative to a historical average for a normalized measurement of volume, as discussed by Melvin Dickover in his April 2014 Stocks and Commodities article.
🤖
by ivatan1962
Free
NinjaTrader Indicator
Market Profile
🔑
🌐
✅
Market Profile is a NinjaTrader indicator for classic orderflow analysis based on auction market theory. It includes features like Initial Balance, Open Range, TPO, Price and Volume Histograms, Value Area, POC, and Virgin POC, providing everything essential for an orderflow trader.
🤖
by edsfreedom
Free
NinjaTrader Indicator
Eds Volume Price Bar
🔑
🌐
Eds Volume Price Bar is a free NinjaTrader Indicator that visualizes real-time volume at specific price levels in a volume profile style. Buy and sell volume are visualized separately for gauging volume delta.
🤖
by DeanV
Free
NinjaTrader Indicator
Dvaluearea
🔑
🌐
✅
Dvaluearea is a NinjaTrader Indicator that visualizes intra-day volume distribution based on session data. It displays the day's Value Area and highlights key levels with unusual volume activity.
🤖
by NinjaTrader_ChelseaB
Free
NinjaTrader Indicator
Igmarketprofile
🔑
🌐
✅
🏅
Igmarketprofile is a free NinjaTrader Indicator that analyzes volume distribution across various price levels for classical orderflow analysis and easy identification of points of control (POC).
🤖
by PaulMohn
Free
NinjaTrader Indicator
SimplePOC – Non TickReplay POC Script Use
🔑
SimplePOC – Non TickReplay POC Script Use is a NinjaTrader indicator that visualizes the Point of Control within candles using a simple white line and additionally displays regular volume data in a secondary panel.
🤖
by siroki
Free
NinjaTrader Indicator
Vwap (Volume Weighted Average Price)
🔑
🌐
✅
Vwap (Volume Weighted Average Price) is a NinjaTrader Indicator that calculates and plots the 1-day VWAP over intraday price charts.
🤖
by GillRymhes
Free
NinjaTrader Indicator
Delta Volume Update
🔑
🌐
✅
Delta Volume Update is a free NinjaTrader Indicator that visualizes volume delta in a simple histogram. Optionally visualizes cumulative volume delta and cumulative volume delta divergences.
🤖
by Sim22
Free
NinjaTrader Indicator
Equivolume ++ Chartstyle
🔑
🌐
Equivolume ++ Chartstyle is a NinjaTrader Indicator that refines chart visuals by automatically adjusting bar width and spacing based on volume change. This indicator features an autosize option, precise thickness calculations and customizable candlestick opacity.
🤖
by j0hnth0m
Free
NinjaTrader Indicator
Realtime Level Ii/Tick Volume
🔑
🌐
Realtime Level II/Tick Volume is an Indicator that delivers real-time up/down tick volume for the current chart, compatible with any instrument, timeframe and chart type.
🤖
by NinjaTrader_DaveI
Free
NinjaTrader Indicator
Equivolume Chart Style
🔑
Equivolume Chart Style is a free Indicator for NinjaTrader 8 based on traditional Candlesticks adjusted to volume traded, visualized in candlestick width.
🤖
by soon123
Free
NinjaTrader Indicator
RelativeVolume NT8
🔑
🌐
✅
RelativeVolume NT8 is a NinjaTrader Indicator that displays volume magnitude relative to a historical average for a normalized measurement of volume, as discussed by Melvin Dickover in his April 2014 Stocks and Commodities article.
🤖
by ivatan1962
Free
NinjaTrader Indicator
Market Profile
🔑
🌐
✅
Market Profile is a NinjaTrader indicator for classic orderflow analysis based on auction market theory. It includes features like Initial Balance, Open Range, TPO, Price and Volume Histograms, Value Area, POC, and Virgin POC, providing everything essential for an orderflow trader.
🤖
by edsfreedom
Free
NinjaTrader Indicator
Eds Volume Price Bar
🔑
🌐
Eds Volume Price Bar is a free NinjaTrader Indicator that visualizes real-time volume at specific price levels in a volume profile style. Buy and sell volume are visualized separately for gauging volume delta.
🤖
by DeanV
Free
NinjaTrader Indicator
Dvaluearea
🔑
🌐
✅
Dvaluearea is a NinjaTrader Indicator that visualizes intra-day volume distribution based on session data. It displays the day's Value Area and highlights key levels with unusual volume activity.
🤖
by NinjaTrader_ChelseaB
Free
NinjaTrader Indicator
Igmarketprofile
🔑
🌐
✅
🏅
Igmarketprofile is a free NinjaTrader Indicator that analyzes volume distribution across various price levels for classical orderflow analysis and easy identification of points of control (POC).
🤖
by PaulMohn
Free
NinjaTrader Indicator
SimplePOC – Non TickReplay POC Script Use
🔑
SimplePOC – Non TickReplay POC Script Use is a NinjaTrader indicator that visualizes the Point of Control within candles using a simple white line and additionally displays regular volume data in a secondary panel.
🤖
by siroki
Free
NinjaTrader Indicator
Vwap (Volume Weighted Average Price)
🔑
🌐
✅
Vwap (Volume Weighted Average Price) is a NinjaTrader Indicator that calculates and plots the 1-day VWAP over intraday price charts.
🤖
by GillRymhes
Free
NinjaTrader Indicator
Delta Volume Update
🔑
🌐
✅
Delta Volume Update is a free NinjaTrader Indicator that visualizes volume delta in a simple histogram. Optionally visualizes cumulative volume delta and cumulative volume delta divergences.
🤖
by Sim22
Free
NinjaTrader Indicator
Equivolume ++ Chartstyle
🔑
🌐
Equivolume ++ Chartstyle is a NinjaTrader Indicator that refines chart visuals by automatically adjusting bar width and spacing based on volume change. This indicator features an autosize option, precise thickness calculations and customizable candlestick opacity.
🤖
by j0hnth0m
Free
NinjaTrader Indicator
Realtime Level Ii/Tick Volume
🔑
🌐
Realtime Level II/Tick Volume is an Indicator that delivers real-time up/down tick volume for the current chart, compatible with any instrument, timeframe and chart type.
🤖
by NinjaTrader_DaveI
Free
NinjaTrader Indicator
Equivolume Chart Style
🔑
Equivolume Chart Style is a free Indicator for NinjaTrader 8 based on traditional Candlesticks adjusted to volume traded, visualized in candlestick width.
Discover trading edge
Discover trading edge
Indicators, Platforms & Education
Indicators, Platforms & Education
TradersList
Discover trading edge
Join Telegram
Weekly listings
Join Telegram
Disclaimer
Our goal is to achieve greater transparency, guidance and safety in trading and investing by providing means to discover, research and discuss trading/investing related sites/services.
Content provided on this site is not financial advice, meant for educational purposes only. TradersList does not endorse or guarantee any result for listed sites/services. Do your own research.
Read full disclaimer
TradersList
Discover trading edge
Join Telegram
Disclaimer
Our goal is to achieve greater transparency, guidance and safety in trading and investing by providing means to discover, research and discuss trading/investing related sites/services.
Content provided on this site is not financial advice, meant for educational purposes only. TradersList does not endorse or guarantee any result for listed sites/services. Do your own research.
Read full disclaimer