

From TradersList Editors
From TradersList Editors
Gain insights by visualizing key candle zones to predict market shifts and refine trading strategies with historical data analysis.
Gain insights by visualizing key candle zones to predict market shifts and refine trading strategies with historical data analysis.


NinjaTrader Indicator
NinjaTrader Indicator
Intrabar Key Levels using this free NinjaTrader indicator
Intrabar Key Levels using this free NinjaTrader indicator

by bobc635 on NinjaTrader
by bobc635 on NinjaTrader
by bobc635 on NinjaTrader
🤖
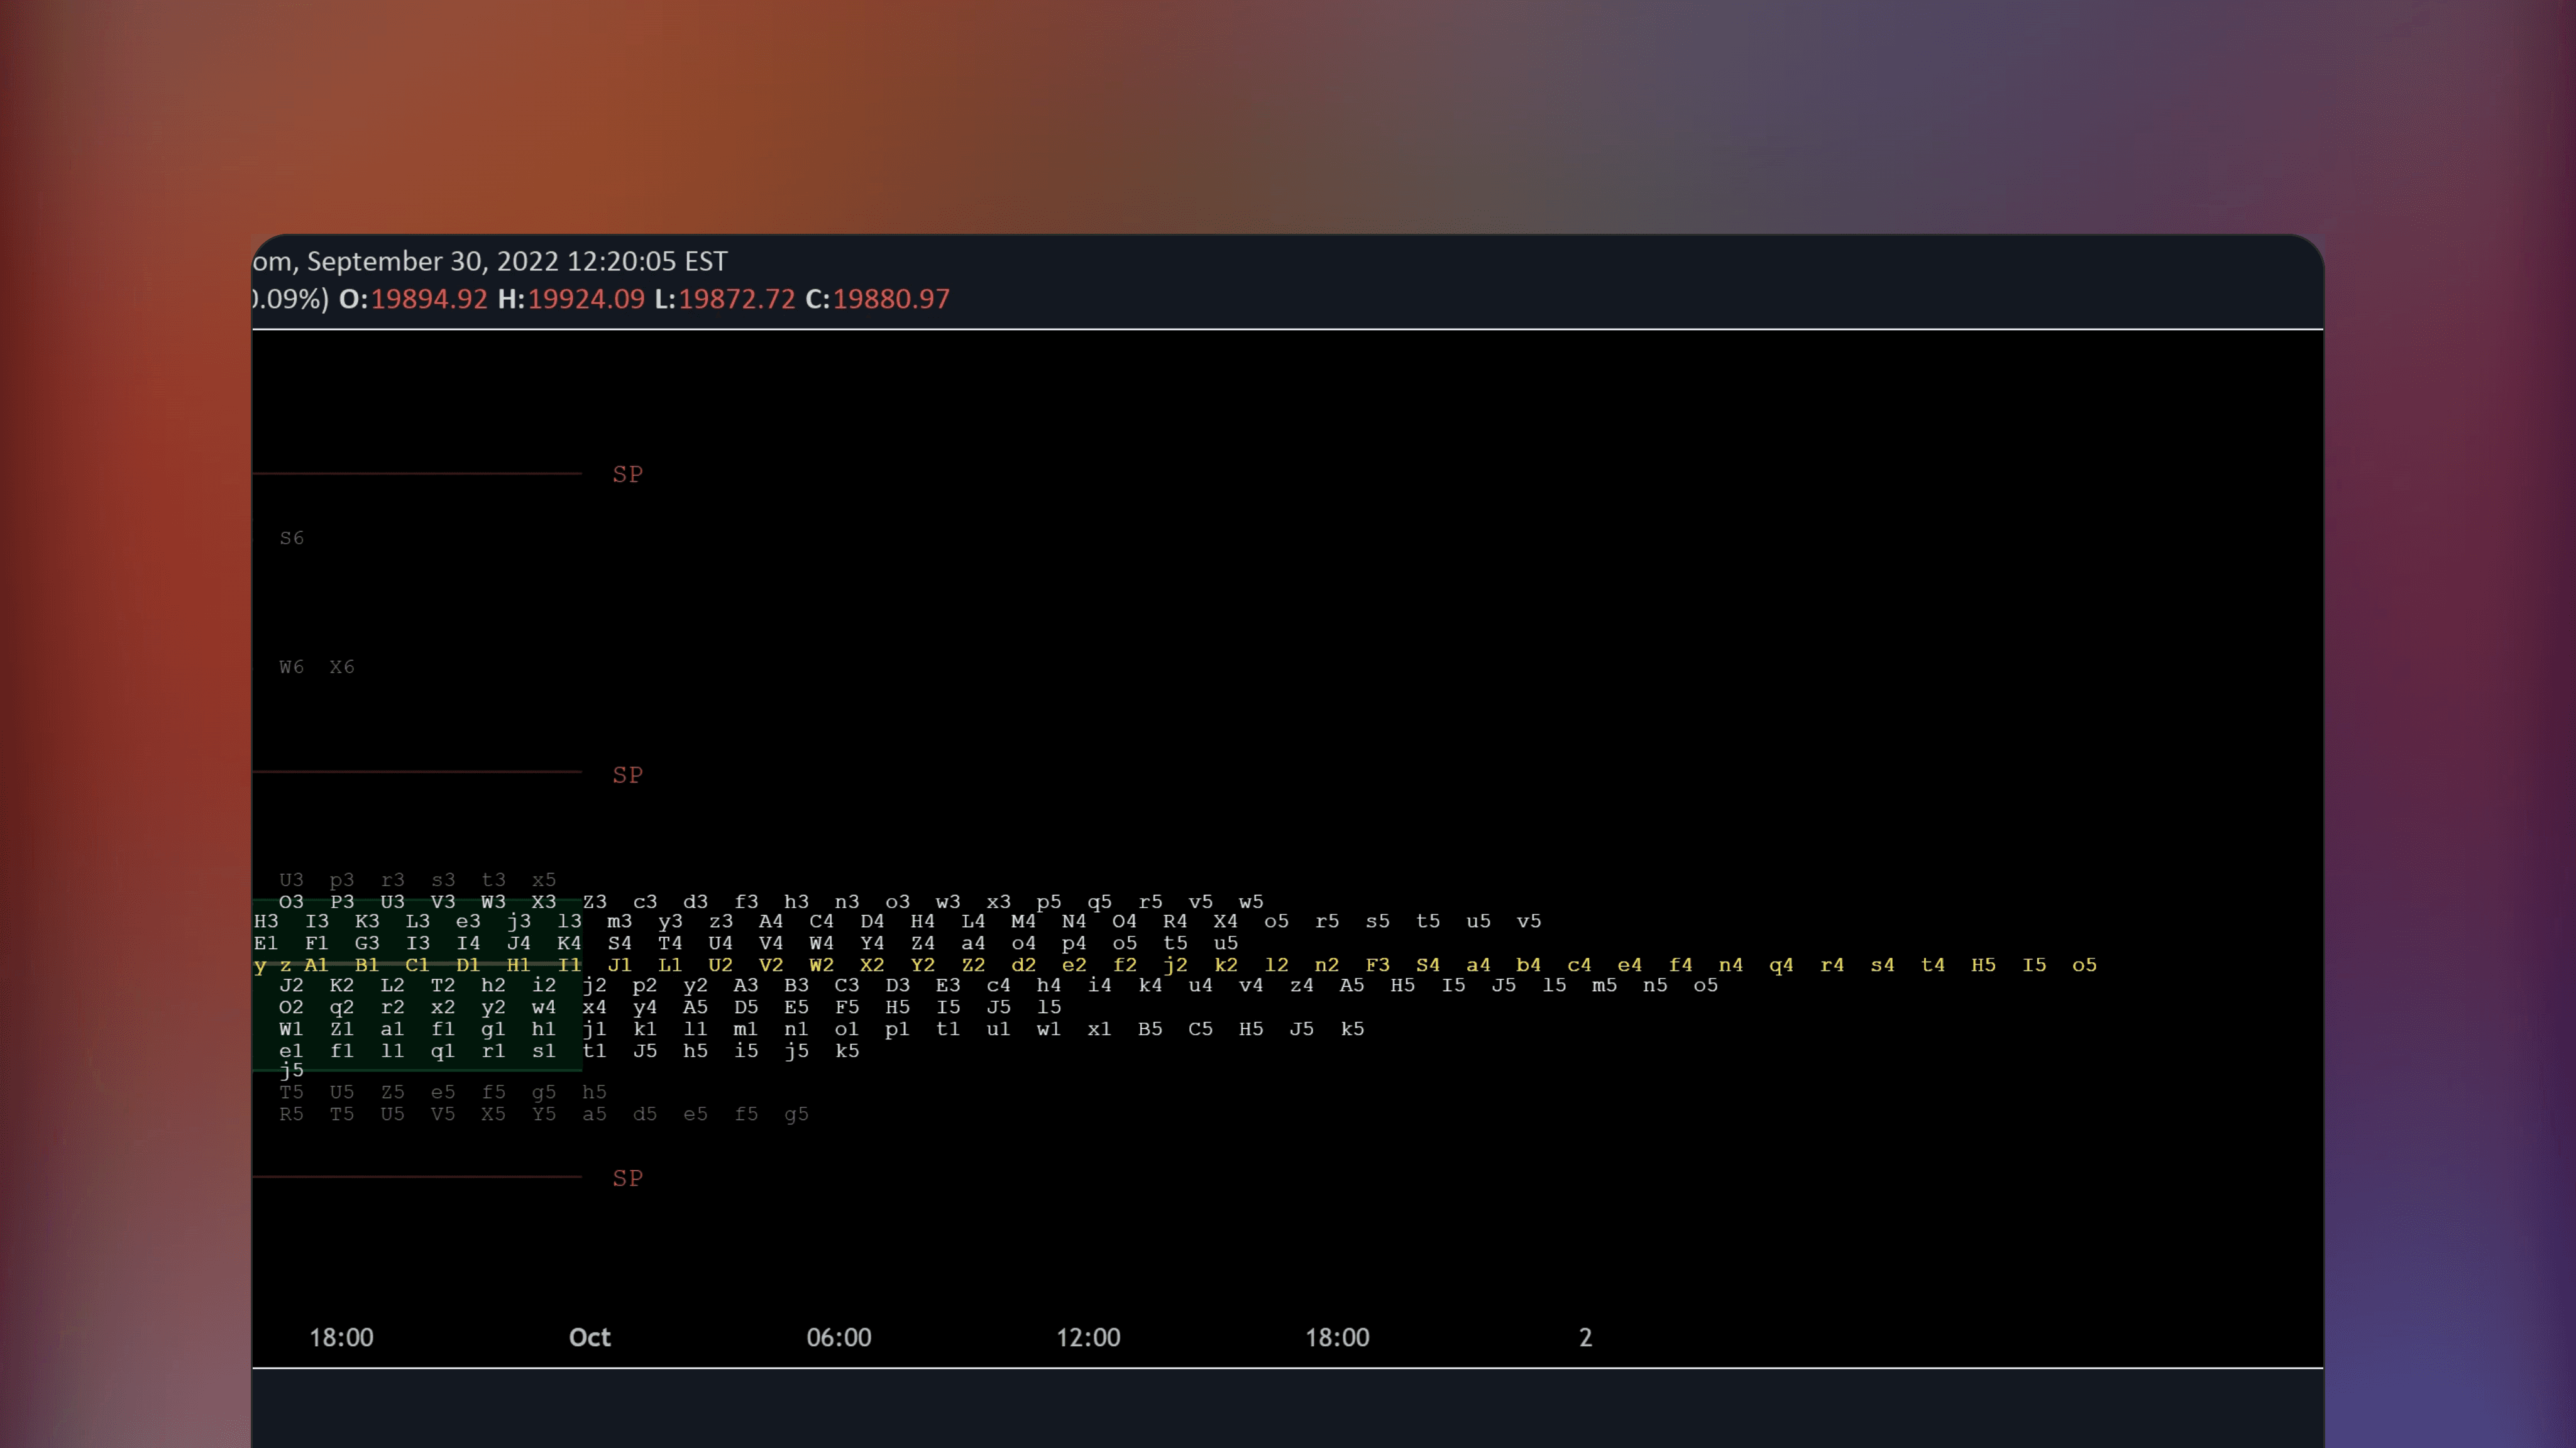
Candle Quarters is a free NinjaTrader indicator that marks the 25%, 50%, 75% levels within price action candles for quick and simple intrabar support and resistance.
Candle Quarters is a free NinjaTrader indicator that marks the 25%, 50%, 75% levels within price action candles for quick and simple intrabar support and resistance.
Get on NinjaTrader
This indicator is available on NinjaTrader charting platform. Signing up for a free account and downloading NinjaTrader software is required.
Get on NinjaTrader
This indicator is available on NinjaTrader charting platform. Signing up for a free account and downloading NinjaTrader software is required.
🔑
Open Source
Listing has publically available source code that can be audited and modified as needed.
🔑
Open Source
Listing has publically available source code that can be audited and modified as needed.
💸
Free Access
All features of this listing are fully free to use with no pricing tiers. Simply start using.
💸
Free Access
All features of this listing are fully free to use with no pricing tiers. Simply start using.
Published by bobc635 on NinjaTrader
Published by bobc635 on NinjaTrader
Featured Dec 6, 2024
Featured Dec 6, 2024
Simple intrabar levels for support and resistance
Simple intrabar levels for support and resistance
This NinjaTrader Indicator uses central points within price action candles for simple support/resistance levels. Let's take a look at how you can incorporate Candle Quarters into your market analysis.
This NinjaTrader Indicator uses central points within price action candles for simple support/resistance levels. Let's take a look at how you can incorporate Candle Quarters into your market analysis.
1
1
Identify potential key levels
Identify potential key levels
2
2
Streamline price action analysis
Streamline price action analysis
3
3
Filter noise from price data
Filter noise from price data
😃
😃
Traders are happy with this
Traders are happy with this
Users on the web convey a positive sentiment towards Candle Quarters, appreciating its community support, customization options, and practical tools in enhancing their trading experience.
Users on the web convey a positive sentiment towards Candle Quarters, appreciating its community support, customization options, and practical tools in enhancing their trading experience.
Source: Online Discussion
Source: Online Discussion
Source: Online Discussion


Bookmark
Saved here
🤖
Get Indicator
Find Indicator
3
Comments
Read on Telegram
Listing by third party publisher. Not financial advice.
Risk Disclosure


Share Listing
🤖
🤖
Get Indicator
Get Indicator
Find Indicator
Find Indicator
Saved here
Bookmark
Listing by third party publisher. Not financial advice.
Listing by third party publisher. Not financial advice.
Risk Disclosure
Risk Disclosure
Share
🤖
3


🤖
3
🤖
3
🔥
New Listings
Featured this week
🤖
by KioseffTrading


Free
TradingView Indicator
TPO Market Profile [Kioseff Trading]
New
🔑
🌐
✅
TPO Market Profile [Kioseff Trading] is a TradingView Indicator that displays a market profile distribution of time. The indicator maps out how much time was spent at each price level, working on all timeframes. Users can fully customize when the profile resets (e.g., daily or every few hours/days) and can also view profiles from past sessions. Important levels like Point of Control (POC) and the Value Area (VAH/VAL) included.

🤖
by armybender


Free
ThinkOrSwim Indicator
Ehler's Instantaneous Trend [LazyBear] For ThinkOrSwim
New
🔑
Ehler's Instantaneous Trend [LazyBear] For ThinkOrSwim is a free moving average Indicator based on Ehler's Instantaneous Trend. This moving average is calculated based on John Ehler's earliest implementations, acting similarly to Hull Moving Average (HMA) with minimal lag.

🤖
by LeviathanCapital
Free
TradingView Indicator
Volume / Open Interest "Footprint" - By Leviathan
New
🔑
🌐
✅
Volume Open Interest Footprint by Leviathan is a TradingView indicator that visualizes trading activity using footprint-style bars based on aggregated volume or open interest data within the visible chart range. The indicator offers three heatmap options: Volume Delta/OI Delta, Total Volume/Total OI, and Buy vs Sell Volume/OI changes.
Load More
🤖
by KioseffTrading
Free
TradingView Indicator
TPO Market Profile [Kioseff Trading]
New
🔑
🌐
✅
TPO Market Profile [Kioseff Trading] is a TradingView Indicator that displays a market profile distribution of time. The indicator maps out how much time was spent at each price level, working on all timeframes. Users can fully customize when the profile resets (e.g., daily or every few hours/days) and can also view profiles from past sessions. Important levels like Point of Control (POC) and the Value Area (VAH/VAL) included.
🤖
by armybender
Free
ThinkOrSwim Indicator
Ehler's Instantaneous Trend [LazyBear] For ThinkOrSwim
New
🔑
Ehler's Instantaneous Trend [LazyBear] For ThinkOrSwim is a free moving average Indicator based on Ehler's Instantaneous Trend. This moving average is calculated based on John Ehler's earliest implementations, acting similarly to Hull Moving Average (HMA) with minimal lag.
Load More
🤖
Similar Listings
Traders also viewed
All


🤖
by dnoff
Free
NinjaTrader Indicator
Mtg Gap Zones
🔑
🌐
Mtg Gap Zones is a NinjaTrader Indicator that applies the Master the Gap Opening Gap Zone strategy, analyzing today's market open relative to the previous day's close, open, high, and low to form long/short bias for intraday trading.

🤖
by bobc636
Free
NinjaTrader Indicator
ADXVMA Color Bands
🔑
ADXVMA Color Bands is a NinjaTrader Indicator that adds color-coded trend identification and customizable volatility channels to the ADXVMA. Users can set colors for up, down, and neutral trends and adjust volatility band multipliers for tailored price action analysis use cases.

🤖
by NinjaTrader_Jim
Free
NinjaTrader Indicator
MeanReversal Strategy NT8
🔑
🌐
🏅
MeanReversal Strategy NT8 is a NinjaTrader Indicator based on Anthony Garner’s 2019 backtested mean-reversion strategy, identifying assets that have moved to extremes from their mean for potential reversion.

🤖
by zacharydw00
Free
NinjaTrader Indicator
Fair Value Gap (ICT)
🔑
🌐
✅
Fair Value Gap (ICT) is a NinjaTrader Indicator that detects market imbalances, more specifically fair value gaps. In this implementation, FVG bars are required to align in trend direction and restricted on specific conditions like Silver Bullet criteria being met or regular trading hours being on.

🤖
by adtsystems
Free
NinjaTrader Indicator
ICT Macros
🔑
✅
ICT Macros is a NinjaTrader indicator that identifies and classifies time intervals where algorithmic trading is believed to generate liquidity, highlighting key market periods in accordance with ICT concepts.

🤖
by Sim22
Free
NinjaTrader Indicator
Quarterly Bars Type
🔑
🌐
Quarterly Bars Type is a NinjaTrader indicator that segments trading data into US quarters - Jan–Mar, Apr–Jun, Jul–Sep, and Oct–Dec - offering a structured view distinct from using standard three month timeframe.

🤖
by monpere
Free
NinjaTrader Indicator
Dynamicsrlines
🔑
🌐
Dynamicsrlines is a NinjaTrader Indicator that draws horizontal support and resistance lines where multiple swing highs or lows have formed previously, offering added confluence for high identifying high probability levels.

🤖
by NinjaTrader_Paul
Free
NinjaTrader Indicator
Heiken Ashi 8
🔑
🌐
Heiken Ashi 8 is a NinjaTrader 8 Indicator that uses Heiken Ashi candles to smooth price action and filter out market noise across various timeframes from tick charts to monthly charts.

🤖
by NinjaTrader_ChelseaB
Free
NinjaTrader Indicator
UniRenko Universal Renko BarType 8
🔑
🏅
UniRenko Universal Renko BarType 8 is a NinjaTrader indicator that converts regular price data into Renko block patterns.

🤖
by chartish
Free
NinjaTrader Indicator
Opening Range Indicator
🔑
🌐
The Opening Range Indicator is a NinjaTrader Indicator that marks key price levels by drawing lines at the highs and lows of user-defined range to calculate opening range.

🤖
by NinjaTrader_Tim
Free
NinjaTrader Indicator
Mcclellan Oscillator
🔑
🌐
✅
The Mcclellan Oscillator is a NinjaTrader Indicator that measures NYSE broad market momentum and direction by calculating the difference between advancing and declining issues, also known as market breadth.

🤖
by NinjaTrader_PatrickH
Free
NinjaTrader Indicator
Exponential Standard Deviation Bands
🔑
🏅
Exponential Standard Deviation Bands is a free NinjaTrader indicator that applies exponential smoothing to standard deviation bands for quicker adaptation to market changes. Concept by Vitali Apirine, published in the February 2017 issue of Stocks and Commodities.

🤖
by NinjaTrader_Ray
Free
NinjaTrader Indicator
Automatic Trend Line Detection
🔑
🌐
Automatic Trend Line Detection is a free Indicator for NinjaTrader that automatically detects and visualizes diagonal trend lines on stock charts. Concept originally published in the September 07 issue of Stocks & Commodities magazine.

🤖
by NinjaTrader_JoshG
Free
NinjaTrader Indicator
Auto-Regressive Model Indicator
🔑
🌐
Auto-Regressive Model Indicator is a NinjaTrader indicator that uses historical data and machine learning to forecast closing prices. The algorithm learns relationships between current and past values with a decreasing learning rate for stability, provides error bounds and standardizes predictions by Z-scoring the time series.
🤖
by dnoff
Free
NinjaTrader Indicator
Mtg Gap Zones
🔑
🌐
Mtg Gap Zones is a NinjaTrader Indicator that applies the Master the Gap Opening Gap Zone strategy, analyzing today's market open relative to the previous day's close, open, high, and low to form long/short bias for intraday trading.
🤖
by bobc636
Free
NinjaTrader Indicator
ADXVMA Color Bands
🔑
ADXVMA Color Bands is a NinjaTrader Indicator that adds color-coded trend identification and customizable volatility channels to the ADXVMA. Users can set colors for up, down, and neutral trends and adjust volatility band multipliers for tailored price action analysis use cases.
🤖
by NinjaTrader_Jim
Free
NinjaTrader Indicator
MeanReversal Strategy NT8
🔑
🌐
🏅
MeanReversal Strategy NT8 is a NinjaTrader Indicator based on Anthony Garner’s 2019 backtested mean-reversion strategy, identifying assets that have moved to extremes from their mean for potential reversion.
🤖
by zacharydw00
Free
NinjaTrader Indicator
Fair Value Gap (ICT)
🔑
🌐
✅
Fair Value Gap (ICT) is a NinjaTrader Indicator that detects market imbalances, more specifically fair value gaps. In this implementation, FVG bars are required to align in trend direction and restricted on specific conditions like Silver Bullet criteria being met or regular trading hours being on.
🤖
by adtsystems
Free
NinjaTrader Indicator
ICT Macros
🔑
✅
ICT Macros is a NinjaTrader indicator that identifies and classifies time intervals where algorithmic trading is believed to generate liquidity, highlighting key market periods in accordance with ICT concepts.
🤖
by Sim22
Free
NinjaTrader Indicator
Quarterly Bars Type
🔑
🌐
Quarterly Bars Type is a NinjaTrader indicator that segments trading data into US quarters - Jan–Mar, Apr–Jun, Jul–Sep, and Oct–Dec - offering a structured view distinct from using standard three month timeframe.
🤖
by monpere
Free
NinjaTrader Indicator
Dynamicsrlines
🔑
🌐
Dynamicsrlines is a NinjaTrader Indicator that draws horizontal support and resistance lines where multiple swing highs or lows have formed previously, offering added confluence for high identifying high probability levels.
🤖
by NinjaTrader_Paul
Free
NinjaTrader Indicator
Heiken Ashi 8
🔑
🌐
Heiken Ashi 8 is a NinjaTrader 8 Indicator that uses Heiken Ashi candles to smooth price action and filter out market noise across various timeframes from tick charts to monthly charts.
🤖
by NinjaTrader_ChelseaB
Free
NinjaTrader Indicator
UniRenko Universal Renko BarType 8
🔑
🏅
UniRenko Universal Renko BarType 8 is a NinjaTrader indicator that converts regular price data into Renko block patterns.
🤖
by chartish
Free
NinjaTrader Indicator
Opening Range Indicator
🔑
🌐
The Opening Range Indicator is a NinjaTrader Indicator that marks key price levels by drawing lines at the highs and lows of user-defined range to calculate opening range.
🤖
by NinjaTrader_Tim
Free
NinjaTrader Indicator
Mcclellan Oscillator
🔑
🌐
✅
The Mcclellan Oscillator is a NinjaTrader Indicator that measures NYSE broad market momentum and direction by calculating the difference between advancing and declining issues, also known as market breadth.
🤖
by NinjaTrader_PatrickH
Free
NinjaTrader Indicator
Exponential Standard Deviation Bands
🔑
🏅
Exponential Standard Deviation Bands is a free NinjaTrader indicator that applies exponential smoothing to standard deviation bands for quicker adaptation to market changes. Concept by Vitali Apirine, published in the February 2017 issue of Stocks and Commodities.
🤖
by NinjaTrader_Ray
Free
NinjaTrader Indicator
Automatic Trend Line Detection
🔑
🌐
Automatic Trend Line Detection is a free Indicator for NinjaTrader that automatically detects and visualizes diagonal trend lines on stock charts. Concept originally published in the September 07 issue of Stocks & Commodities magazine.
🤖
by NinjaTrader_JoshG
Free
NinjaTrader Indicator
Auto-Regressive Model Indicator
🔑
🌐
Auto-Regressive Model Indicator is a NinjaTrader indicator that uses historical data and machine learning to forecast closing prices. The algorithm learns relationships between current and past values with a decreasing learning rate for stability, provides error bounds and standardizes predictions by Z-scoring the time series.
🤖
by dnoff
Free
NinjaTrader Indicator
Mtg Gap Zones
🔑
🌐
Mtg Gap Zones is a NinjaTrader Indicator that applies the Master the Gap Opening Gap Zone strategy, analyzing today's market open relative to the previous day's close, open, high, and low to form long/short bias for intraday trading.
🤖
by bobc636
Free
NinjaTrader Indicator
ADXVMA Color Bands
🔑
ADXVMA Color Bands is a NinjaTrader Indicator that adds color-coded trend identification and customizable volatility channels to the ADXVMA. Users can set colors for up, down, and neutral trends and adjust volatility band multipliers for tailored price action analysis use cases.
🤖
by NinjaTrader_Jim
Free
NinjaTrader Indicator
MeanReversal Strategy NT8
🔑
🌐
🏅
MeanReversal Strategy NT8 is a NinjaTrader Indicator based on Anthony Garner’s 2019 backtested mean-reversion strategy, identifying assets that have moved to extremes from their mean for potential reversion.
🤖
by zacharydw00
Free
NinjaTrader Indicator
Fair Value Gap (ICT)
🔑
🌐
✅
Fair Value Gap (ICT) is a NinjaTrader Indicator that detects market imbalances, more specifically fair value gaps. In this implementation, FVG bars are required to align in trend direction and restricted on specific conditions like Silver Bullet criteria being met or regular trading hours being on.
🤖
by adtsystems
Free
NinjaTrader Indicator
ICT Macros
🔑
✅
ICT Macros is a NinjaTrader indicator that identifies and classifies time intervals where algorithmic trading is believed to generate liquidity, highlighting key market periods in accordance with ICT concepts.
🤖
by Sim22
Free
NinjaTrader Indicator
Quarterly Bars Type
🔑
🌐
Quarterly Bars Type is a NinjaTrader indicator that segments trading data into US quarters - Jan–Mar, Apr–Jun, Jul–Sep, and Oct–Dec - offering a structured view distinct from using standard three month timeframe.
🤖
by monpere
Free
NinjaTrader Indicator
Dynamicsrlines
🔑
🌐
Dynamicsrlines is a NinjaTrader Indicator that draws horizontal support and resistance lines where multiple swing highs or lows have formed previously, offering added confluence for high identifying high probability levels.
🤖
by NinjaTrader_Paul
Free
NinjaTrader Indicator
Heiken Ashi 8
🔑
🌐
Heiken Ashi 8 is a NinjaTrader 8 Indicator that uses Heiken Ashi candles to smooth price action and filter out market noise across various timeframes from tick charts to monthly charts.
🤖
by NinjaTrader_ChelseaB
Free
NinjaTrader Indicator
UniRenko Universal Renko BarType 8
🔑
🏅
UniRenko Universal Renko BarType 8 is a NinjaTrader indicator that converts regular price data into Renko block patterns.
🤖
by chartish
Free
NinjaTrader Indicator
Opening Range Indicator
🔑
🌐
The Opening Range Indicator is a NinjaTrader Indicator that marks key price levels by drawing lines at the highs and lows of user-defined range to calculate opening range.
Discover trading edge
Discover trading edge
Indicators, Platforms & Education
Indicators, Platforms & Education
TradersList
Discover trading edge
Join Telegram
Weekly listings
Join Telegram
Disclaimer
Our goal is to achieve greater transparency, guidance and safety in trading and investing by providing means to discover, research and discuss trading/investing related sites/services.
Content provided on this site is not financial advice, meant for educational purposes only. TradersList does not endorse or guarantee any result for listed sites/services. Do your own research.
Read full disclaimer
TradersList
Discover trading edge
Join Telegram
Disclaimer
Our goal is to achieve greater transparency, guidance and safety in trading and investing by providing means to discover, research and discuss trading/investing related sites/services.
Content provided on this site is not financial advice, meant for educational purposes only. TradersList does not endorse or guarantee any result for listed sites/services. Do your own research.
Read full disclaimer